


Many visuals in Power BI support Conditional Formatting through an FX button where I can set it up—for example, using measures, as I showed in the previous article Conditional Formatting based on Field Parameters. So far, we have only talked about the definition of colors. However, conditional formatting isn’t always just about them. There’s a lot more that can be conditionally formatted. For example, the format in which individual columns or measures output is displayed. We can adjust such a format directly in Power BI using the Format String definition or a predefined one. But when it comes to the fact that we need to change it dynamically, we usually have two options. Either reach for the FORMAT() function or reach for Calculation Groups.
The primary difference between these methods?
FORMAT()
- It must be set for each Measure separately
- Native support
- Output is converted into TEXT (data type)
Calculation Groups
- Re-usable at any measure
- Requires external tool
- Respects data type of input
These points can help me a lot when deciding the method I want to use. I will focus on reusability, and for that reason, I will choose Calculate Groups.
Scenario for mass editing the format string This scenario will sound a little crazy, but it could serve well to explain how to work with it within CG (Calculation Groups). Imagine the scenario in which you are preparing a report and do not want to define the number of decimal places for each Measure, whether a percentage or a currency.
We know that the company uses a naming convention when naming measures. The first two characters in the name are reserved for the data type and the number of decimal places.
The first character (specifying data type)
- # - Number
- \% - Percentage
- $ - Currency
The second character (specifying the number of decimal places)
- 0 – Output should not have any decimal places
- 1 (up to 9)
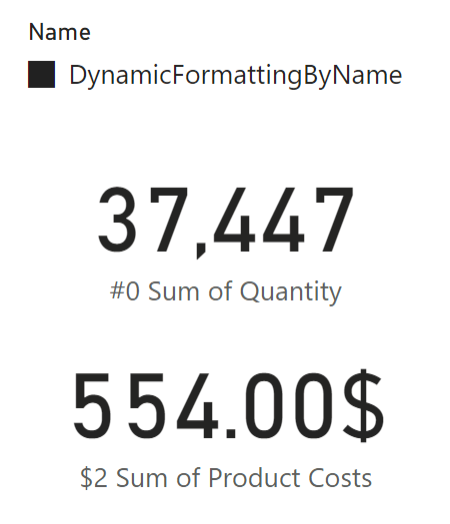
Examples of measure names:
- [#0 Sum of Quantity] – Output should look like a number without any decimal places
- [$2 Sum of Product costs] – Output should be Currency with two decimal places
We now have an idea of what we want to achieve. So let’s solve this within Calculation Groups. I will demonstrate it in the mentioned examples.
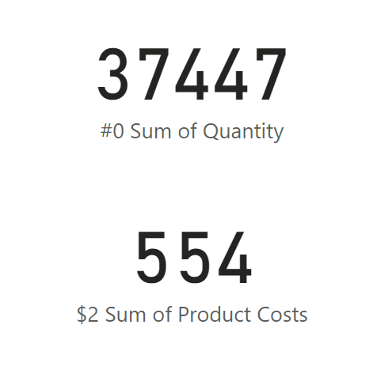 Base numbers in cards
Within Tabular Editor 3, I created a calculation group named MeasureFormatter.
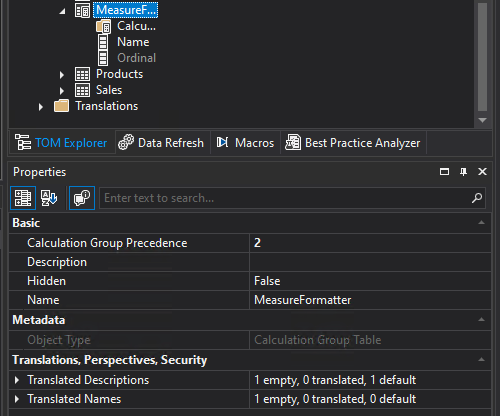 Created calculation group
And within it, I created a Calculation Item called DynamicFormattingByName. This is where the “magic” begins. The first thing that appears to me is the option to edit the Expression that this Item would edit. However, we do not need to modify the Expression in this case. So here, I insert the function SELECTEDMEASURE() so that nothing changes from the point of view of the calculation of the measures themselves.
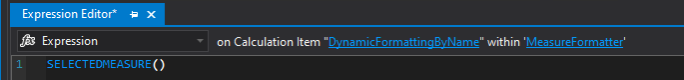 Expression in item Dynamic Formatting by Name
And I switch to Format String Expression. This will show me a new canvas for the dax code.
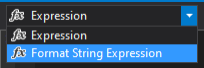 Switch to Format String Expression
Calculation Groups allow us to benefit from functions that directly deal with the measures their items target. These features include:
- SELECTEDMEASURE()
- SELECTEDMEASURENAME()
- SELECTEDMEASUREFORMATSTRING()
- ISSELECTEDMEASURE()
And the just mentioned SELECTEDMEASURENAME() can return us a name from which we can extract that prefix:
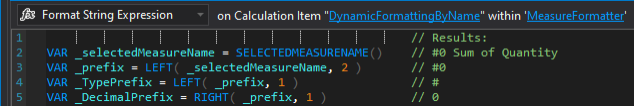 First part of Calculation
Once I have the prefixes, I can start editing the Format String. SWITCH() can help me with that, where I can say that if “_TypePrefix” is equal to the value “#”, then the calculation is kept differently than for “$” or “\%”. However, deciding how the formats should look for our purposes is still good. Because for example, the Currency is sometimes displayed with the currency symbol before the number and sometimes after. I will choose the character’s placement after the number for this demonstration. So I will have two format directions. One when I have a pure number (“#”) and one when I have to place the appropriate character after the number ({“\%”, “$”}). If someone doesn’t follow this syntax, I’ll return the default string format that the Measure has preset.
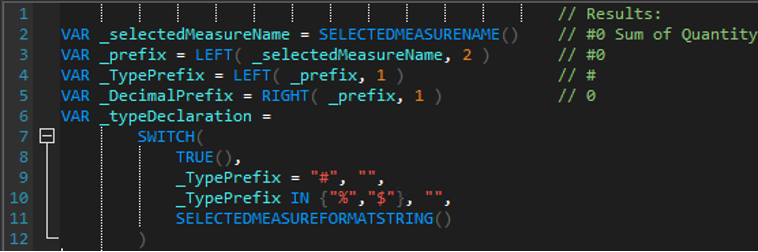 Update of calculation
In the code above, I’m ignoring decimal places yet. The time for those is coming right now. But again, a small warning is helpful. The LEFT() and RIGHT() functions work with texts. Therefore, I have to consider that our number is also text and will need to be converted to a number format. The most straightforward conversion now will be in the form of adding an INT() function within the “_DecimalPrefix” variable, which will wrap up the original RIGHT() function.
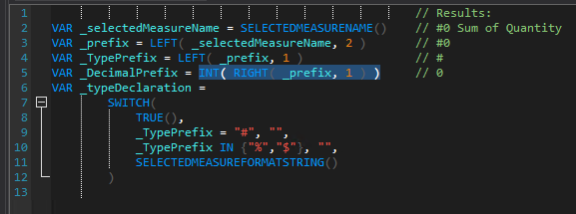 INT() Update
Now it’s just a game with strings that we want to return. We can also use the REPT() function, which creates the specified text string as often as we say. This is very handy when we want to care about decimal places.
|
DynamicFormattingByName (CG Format String Expression) =
VAR _selectedMeasureName = SELECTEDMEASURENAME () // #0 Sum of Quantity VAR _prefix = LEFT ( _selectedMeasureName, 2 ) // #0 VAR _TypePrefix = LEFT ( _prefix, 1 ) // # VAR _DecimalPrefix = INT ( RIGHT ( _prefix, 1 ) ) // 0 VAR _typeDeclaration = SWITCH ( TRUE (), _TypePrefix = "#", IF ( _DecimalPrefix = 0 |
ISBLANK ( _DecimalPrefix ), ”#”, ”#.” & REPT ( “0”, _DecimalPrefix ) ), _TypePrefix IN { ”%”, ”$” }, IF ( _DecimalPrefix = 0 |
Applied this Item, for example, using the Filter Pane or within the Slicer, it modifies the original measures, and we can immediately see that the output is already conditionally formatted.
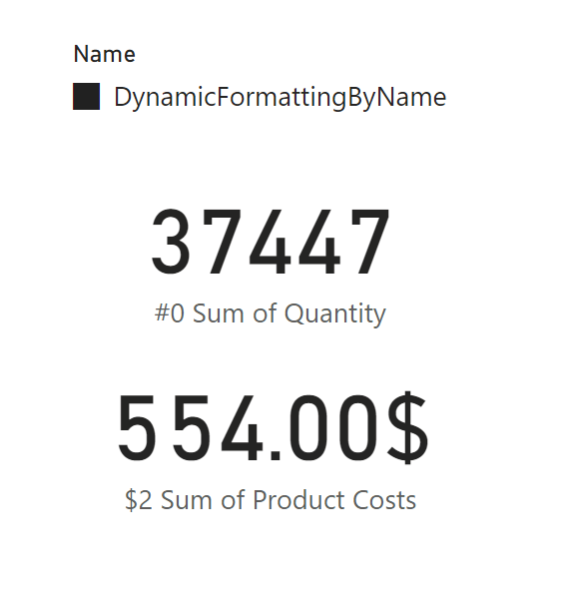 Base numbers formatted
It would still like to add a thousand separators. You may need many of them, but they can be easily added to the Item.
|
DynamicFormattingByName (CG Format String Expression) =
VAR _selectedMeasureName = SELECTEDMEASURENAME () VAR _prefix = LEFT ( _selectedMeasureName, 2 ) // #0 VAR _TypePrefix = LEFT ( _prefix, 1 ) // # VAR _DecimalPrefix = INT ( RIGHT ( _prefix, 1 ) ) // 0 VAR _typeDeclaration = SWITCH ( TRUE (), _TypePrefix = "#", IF ( _DecimalPrefix = 0 |
ISBLANK ( _DecimalPrefix ), ”#,,,,,,,#”, ”#,,,,,,,#.” & REPT ( “0”, _DecimalPrefix ) ), _TypePrefix IN { ”%”, ”$” }, IF ( _DecimalPrefix = 0 |
 Formatting update
Great! We have completed the first scenario. So, we have confirmed that this form of conditional formatting is possible within CG.
Scenario for data labels
Data labels have recently started to support conditional formatting for the color of their text. But that is not the only part that can be conditionally edited. For example, calculated Groups have been able to edit them for quite some time on quite a different level. From that comes the scenario where you only need to see data labels where some condition is met. Our following scenario is based on this.
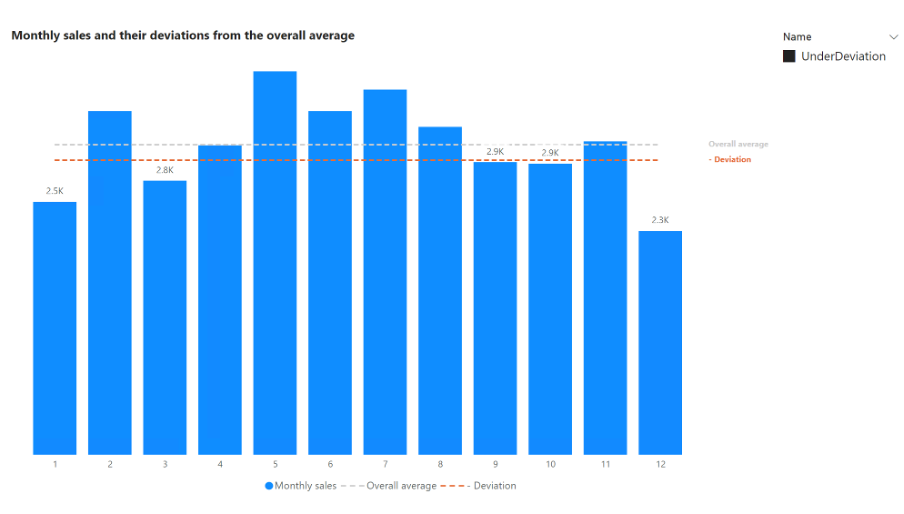
The trader regularly looks at the number of his sales for individual months to know when he has not significantly deviated negatively from the overall average and whether the current month has already exceeded this breakpoint. For him, a deviation from the overall average is problematic if it is deviated by more than 5%.
His chart today that he uses for this analytics looks like this:
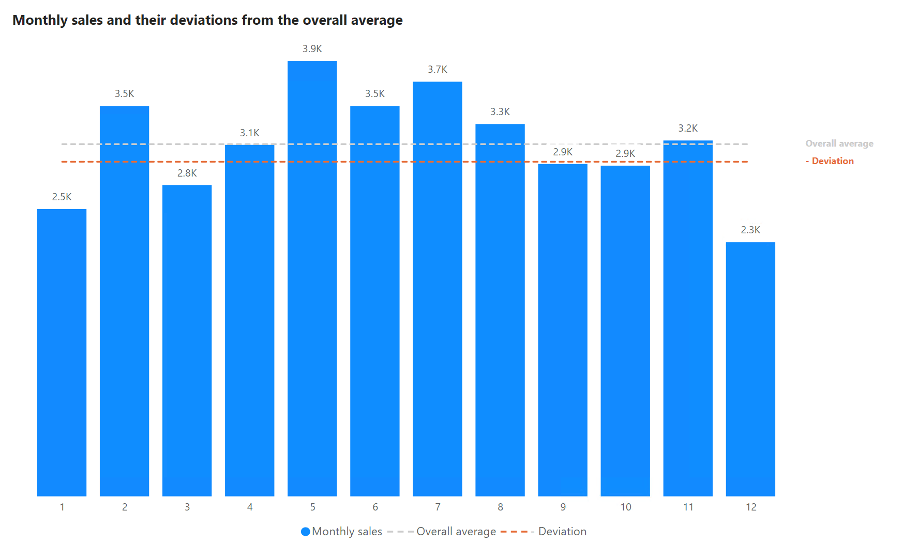 Chart at the begging
It is easy to find the columns below the deviation in such few values. But it could go even faster if we included CG and conditional formatting in the game. We can start here from different sides, either from the side of colors or from the side of data labels. So I’ll stick with labels for a while.
In that scenario, I want to ensure that the behavior I set for the data labels will only apply to the Measure used for Monthly Sales or the previously mentioned Measure named [#0 Sum of Quantity]. Therefore, I will create a new CG called AnalyticalFromatterCG, an item called UnderDeviation.
From the point of view of Expression, for the time being, I will always return the executed Measure using the already known SELECTEDMEASURE() function. You may wonder why I don’t make the results disappear within the Expression or let them be equal to 0. It would be an option, but it would be highly misleading because the user would only see the columns below the deviation in the graph. However, I return the columns and just let the data labels disappear. Format String Expression will serve me for this again.
But this time with an expression that could look like this, for example:
 Wrong Blank Char
ISSELECTEDMEASURE({measure1,measure2,…}) is a function that returns TRUE() if any of the measures defined within the internal attribute is the one the calculation is currently directed against. As almost everyone would have tried, I put empty quotes if I didn’t want to return the format string. (Same as in the picture) But this is just for demonstration purposes. Empty quotes are not supported and are overwritten by the original Format String. So the output looks the same as at the beginning, even if CG is applied to the graph.
 Nothing changed
A supported character must replace empty quotes. For example, UNICHAR(8203) or from the character map, this character:
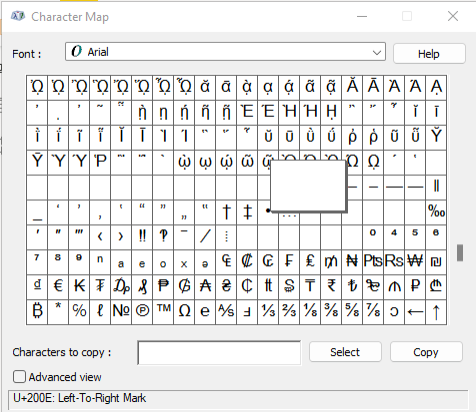 Character map
However, it would be difficult for me to show you in the code because its width is basically 0, and thus it is not visible. So I will use notation with unichar:
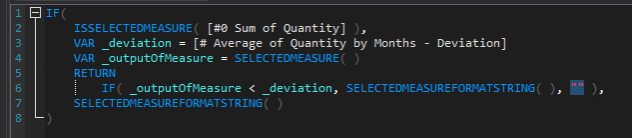
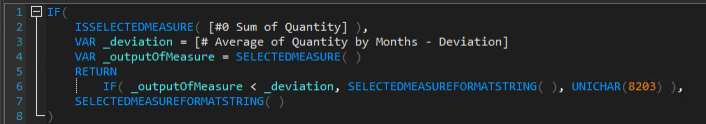 Updated expression
IF (
ISSELECTEDMEASURE ( [#0 Sum of Quantity] ),
VAR _deviation = [# Average of Quantity by Months - Deviation]
VAR _outputOfMeasure =
SELECTEDMEASURE ()
RETURN
IF (
_outputOfMeasure < _deviation,
SELECTEDMEASUREFORMATSTRING (),
UNICHAR ( 8203 )
),
SELECTEDMEASUREFORMATSTRING ()
)
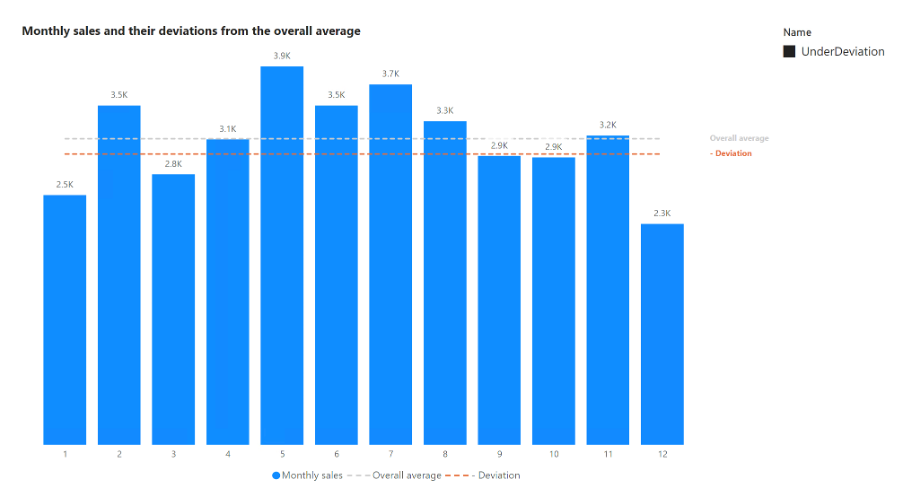
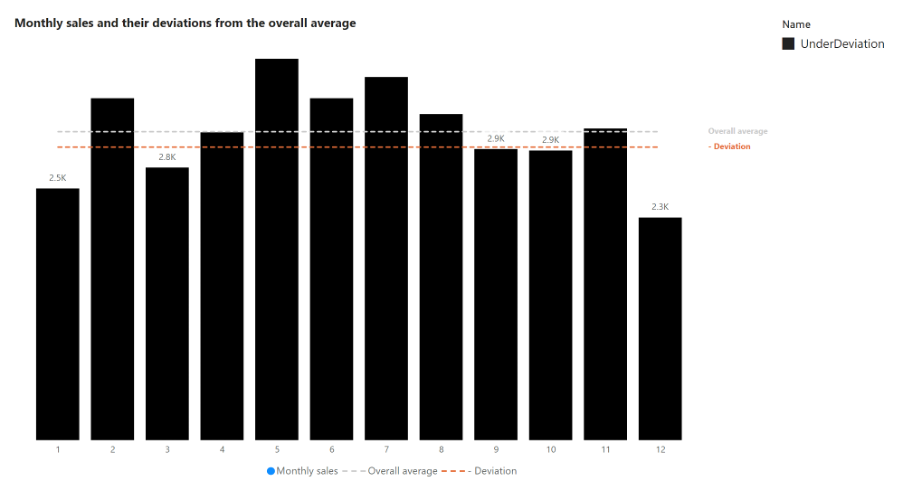
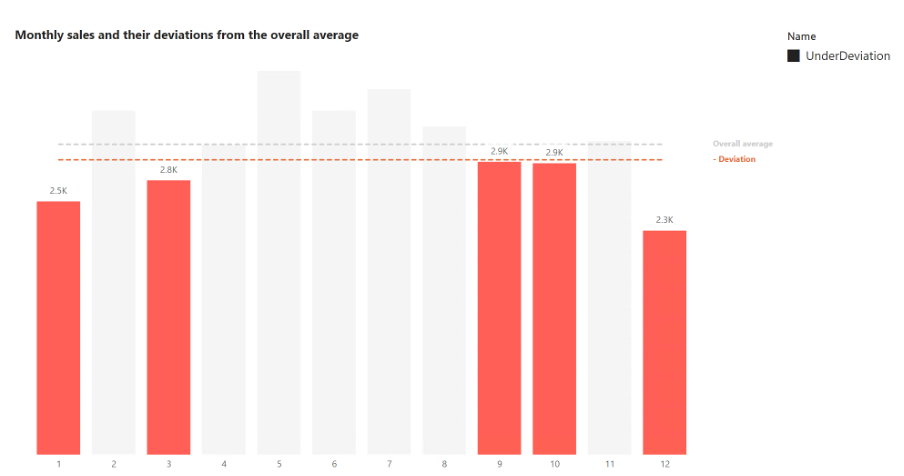
Data labels are now modified as needed, and it works precisely!
 Modified chart
You can already see that the output works well, but what if we wanted to add more colors to the whole thing to highlight it and improve orientation? Of course, we could solve it in another CG, but why run more of them about one graph if it is unnecessary?
Of course, the colors could be solved without CG just by using Measure, but for the sake of demonstration, I’m staying in CG.
First, we must note that we have modified the Format String up to this point. This is because it can handle quite a lot, and its output does not directly change the behavior of the graph as such. But now, we will need to change the Expression, which directly impacts the individual parts of the graph, such as columns or lines.
For that reason, it is not a good idea to manipulate the output measures directly but to use some substitute that will not bother you by overwriting it. Everyone gives such a measure a different name, and sometimes you can find more of them in the model when you need their slightly different connections each time. I use a simple measure from the name [cgColors] and an expression that equals “#000000 “. There is a simple reason why I use a measure whose value is “#000000”. Power BI does not allow you to insert any measure in conditional formatting that does not meet the color conditions. That’s why I insert any color that I will subsequently overwrite.
"#000000"
Chart after inserting [cgColors] into conditional formatting within columns.
 Color formatted by Calculation Group
Now it’s time to return to AnalyticalFormatterCG and its UnderDeviation and Expression. Within this, you can prepare a very similar construct as we prepared in Format String Expression, but this time with the fact that we override Measure [cgColors] and firmly define which two measures make our decisions.
IF (
ISSELECTEDMEASURE ( [cgColors] ),
VAR _deviation = [# Average of Quantity by Months - Deviation]
VAR _outputOfMeasure = [#0 Sum of Quantity]
RETURN
IF ( _outputOfMeasure < _deviation, "#FF5F57", "#F5F5F5" ),
SELECTEDMEASURE ()
)
You can prepare a very similar construct as we prepared in Format String Expression, but this time with the fact that we override MeasureMeasure [cgColors] and firmly define which two measures make our decisions.
 Dynamic Colors by Calculation Group
If I add [cgColors] as conditional formatting for data labels, I get a complete chart controlled by CG. So if I prepared other items that would focus on other issues, such as the highest/lowest value and the like, I could prepare a simple switch for the user to change the examined planes for the chart.
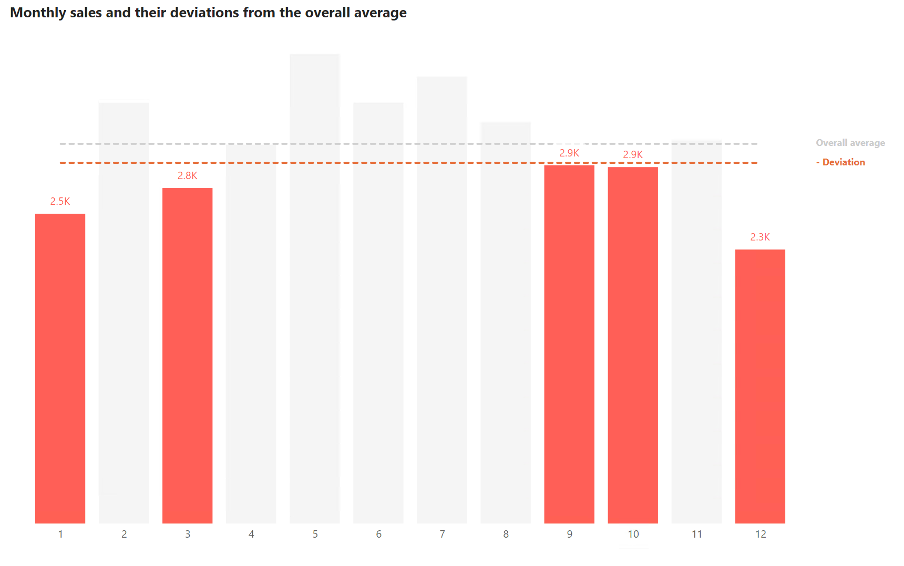 Data labels dynamicaly formatted
And that is one of the many potent qualities that CGs have.
Summary
Calculation Groups are one of the most fantastic objects within the entire Power BI complex. They can be used in countless ways to facilitate development with them. At the same time, they can also be used for something like conditional formatting and thus achieve very dynamic and flexible reports.
Suppose you are interested in more detail about them. In that case, I recommend you check out Bernat Agulló Roselló (BLOG - Esbrina (esbrina-ba.com)), who has fallen completely under their spell and is truly an expert on their scripting and capabilities.
Or to one of my previous articles about the possibilities of Field Parameters in cooperation with Calculation Groups. Field parameters in cooperation with Calculation groups