


Did you know that Power BI can be used as a calculator? Sure, but why would we do that when we have a calculator on almost every other device? So when we need to calculate a simple result of a 3^34 operation, we reach for it to solve the problem. Why on earth do I start with something as trivial as this reasoning? Because you can imagine the Power BI dataset and any other technology/artifact, etc., in precisely the same way. It is always a means to an end. And yes, with a hammer, everything can seem like a nail, even though it may not make sense at first glance.
A Power BI dataset allows us to store data and then run queries over it to get the answers hidden in the stored data. We use DAX and visualizations to transform data into information. Information that was always there, but giving it context suddenly makes it immediately understandable.
For a long time, it was the case that the data and just that information was kept fairly strictly in the dataset, and getting it out to another system meant either doing exports using Excel, for example, copying, re-writing, redrawing charts (okay, I’ve been getting a bit carried away with that…). But a while ago (August 2021) there was a new option allowing us to pull data from a dataset using an API. And that’s just using the ExecuteQuery endpoint. At first, it only appeared as an almost unnoticeable article on the Power BI blog. Then, six months later, another tool in the Power Platform family was added with native support for this endpoint. Yes, I’m talking about Power Automate. Along with Reid Havens, we talked about it that very day in a live stream: Dataset Extraction with REST API.
A lot of time has passed since then. There have been a lot of scenarios where people have started to work with this endpoint because it doesn’t all have to end in Power BI when the extracted information can be brought to users on a silver platter, for example, in MS Teams, integrated into other systems, etc. There is also an exciting challenge here and there! One such challenge was brought to me by Tristan Malherbe. Specifically, it was to download more data than the limit of this API: 1,000,000 values or 100,000 rows - which is the limit for a single query, and it doesn’t matter which of these limits will be met first. I’ll be coming back to this limit.
To meet it, we need to explain some regularities.
Execute Query Endpoint
Performance
As I mentioned, this endpoint allows us to retrieve data from our dataset. That’s a pretty imprecise definition. The point is that it allows you to execute almost any DAX query and returns the answers. MDX and DMV queries aren’t supported according to the documentation. At the same time, according to the official documentation, it is a query that can impersonate another user to access data that the user should see. WARNING!!! THIS IS NOT A SECURITY BREACH!!! A user with WRITE privileges can only execute such a query, so one that always sees the entire data anyway! At the same time, from an endpoint that supports queries via Service Principals, the dataset must not have RLS groups. Because otherwise, an error will also be returned if you query datasets connected via Live Connection.
At the same time, it should be said that you can have this endpoint disabled in your environment from the Power BI Admin portal:
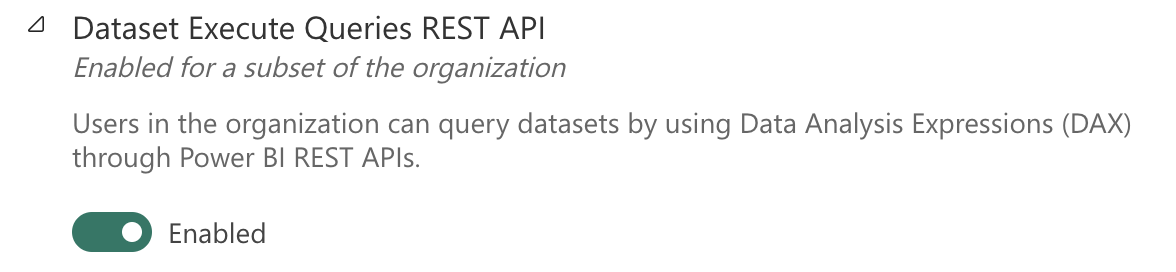 Admin portal
This endpoint works with the POST method and expects the requested DAX query to be part of the provided JSON within the queries. Don’t be fooled! Even though there are “queries” within the requested JSON, according to the documentation, only one query can be executed at a time!
The curl for calling this endpoint is as follows:
curl --location --globoff 'https://api.powerbi.com/v1.0/myorg/groups/{groupId}/datasets/{datasetId}/executeQueries' \
--header 'Content-Type: application/json' \
--header 'Authorization: Bearer {YOUR-TOKEN}' \
--data-raw '{
  "queries": [
    {
      "query": "EVALUATE VALUES(MyTable)"
    }
  ],
  "serializerSettings": {
    "includeNulls": true
  },
  "impersonatedUserName": "someuser@mycompany.com"
}'
At the same time, it is helpful to know that the returned values will again be in a JSON structure and will follow a relatively simple pattern:
- If a column is in the dataset, then its name will be in the format “tableName[columnName]”.
- If it is a column created using our DAX query, then the name of this column will be in the format “[columnName]”, so it will be without the table name
This second option also applies when renaming a column, for example, using the SELECTCOLUMNS() function, so we can sometimes help ourselves by doing this to get rid of the table name and thus be able to process all return values in the same way.
Limits
In terms of limits, this endpoint is very variable. In the year and a little that has existed, new limits are constantly appearing that we must follow.
| Limit | Value |
|---|---|
| Maximum number of tables per query | 1 |
| Maximum number of queries per request | 1 |
| Maximum number of rows returned per query | 100 000 |
| Maximum returned values | 1 0000 000 |
| Maximum data per query | 15MB |
| Maximum requests per minute* | 120 |
*Target dataset does not affect this rate limit. That means 120 simultaneous queries by the whole tenant can be run per minute.
They are there; we must hold on to them to get the answers.
Challenge
The problem
The dataset has about 20 million rows in the table we want to retrieve, which alone tells us that we should exceed both the 1,000,000 value limit and the 100,000-row limit. That this would be the end of our journey? NO WAY!!!
Reflection
We have yet to determine the exact number of rows or the exact number of columns. So we have to operate in the relative plane of variables that are simultaneously independent of each other. But, if I were to rewrite it in some logical notation, we know that:
(Xrows * Ycolumns <= 1,000,000) && (Xrows <= 100,000)
So if we have 100,000 rows and ten columns, it will work because Xrows <= 100,000 and, at the same time, 10 * 100,000 <= 1,000,000. So at the same time, these values show us that ten columns are the maximum number that we can have to get 1,000,000 values with 100,000 rows. So it’s actually the boundary value for the columns.
It will only work if we have 100,000 rows and 100 columns. If we didn’t divide the response acquisition into pages and only sent each other the pages, that would meet our conditions. So relative to the last values, I would have to query pages with 10,000 rows, which would mean querying for ten pages.
DAX allows us to do this in several different ways. For example, usage of the RANKX() function, when we would adjust the values according to the rank. Or usage of the TOPNSKIP() function. Many people have never heard of this function, so in a nutshell, it’s a similar concept to the TOPN() function, but it allows you to select X TOPN rows that are after Y rows.
Entry
Let’s start by having some Power BI datasets in Power BI Service. Specifically, it is a Dataset:
 Dataset
We will want to get data from the “tbl” table from that dataset.
 Table inside dataset
This is a dataset and table designed only for testing purposes of this very scenario. Technically, each column contains the same values 1..X, and 1/2 of the columns are in the number data type and the other in the text data type. So in total, this table has 20 columns and 2,000,000 rows. From this, it follows that it will not be possible to call it within one query, and we have to split it up somehow.
 Data in dataset
Assignment consideration
By having 20 columns, we know that creating windows of 100,000 won’t help us because we would always get more than 1,000,000 values. We can do a simple calculation: 1,000,000 / 20 = 50,000. Which is the number of rows we can ask for in one query. We don’t always need to do this calculation; we only need it if there are more than ten columns. Because if we had five columns, we could get 200,000 rows according to this procedure, which is also impossible due to the limits.
In general, if 1,000,000 / X > 100,000, we must limit the number of rows to 100,000. Otherwise, we will use the result of that division. Next, we need to determine how often we will query the data. This equals the total number of rows / maximum number of columns obtained. In our case, it’s 2,000,000 / 50,000 = 40. So we’ll need to do 40 queries.
That’s quite a bit of thinking to do. Especially if we had to do it manually and, on top of that, find out the number of rows and columns to calculate it, it would take a lot of time. Fortunately, we can prevent this! By making one more “query” to our data source. And yes… I plan to make a calculator out of Power BI!
Power BI as a calculator
I said you could only get one table in one query. But I never said that it could not be thoroughly calculated. What do I mean? What if we counted the number of rows and columns in the variables, performed this intermediate calculation, and returned a table that would be entirely created from these values? That would be great, wouldn’t it? And so we do!
To do this, we’ll start in DAX studio, creating one part at a time!
Number of rows
Getting the row count is simple. The COUNTROWS() function is enough.
VAR _rows =
COUNTROWS ( tbl )
EVALUATE
SELECTCOLUMNS ( { 1 }, "Rows", _rows )
The result will then look like this:
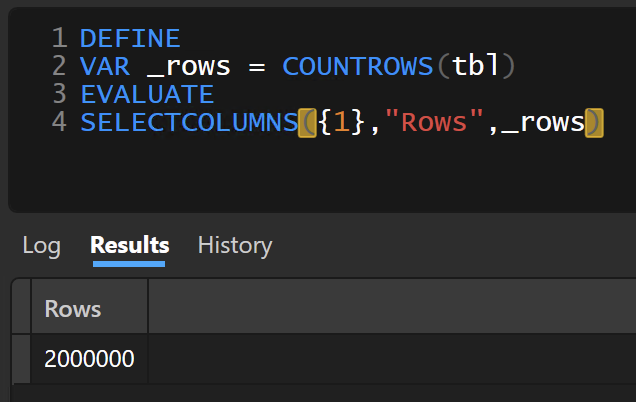 Get Rows
Number of columns
This is more interesting if we want to do it dynamically. So we can do it with a little trick. It consists of the functions TOCSV(), SUBSTITUE() and LEN().
VAR _csv =
TOCSV ( tbl, 0 )
VAR _cols_ =
( LEN ( _csv ) - LEN ( SUBSTITUTE ( _csv, ",", "" ) ) ) + 1
EVALUATE
SELECTCOLUMNS ( { 1 }, "Columns", _cols )
Combination of calculations and extensions
If we combine all this and add the calculation for pagination and page size here, the resulting DAX code will look like this:
VAR _rows =
COUNTROWS ( tbl )
VAR _csv =
TOCSV ( tbl, 0 )
VAR _cols =
( LEN ( _csv ) - LEN ( SUBSTITUTE ( _csv, ",", "" ) ) ) + 1
VAR _maxColumn =
VAR _mX = DIVIDE ( 1000000, _cols ) RETURN IF ( _mX < 100000, _mX, 100000 )
VAR _page =
ROUNDUP ( DIVIDE ( _rows, _maxColumn ), 0 )
EVALUATE
SELECTCOLUMNS (
{ 1 },
"Columns", _cols,
"Rows", _rows,
"MaxColumns", _maxColumn,
"Pages", _page
)
Get calculation results with Power Automate
Within Power Automate today, there are two native options to call the Execute Query endpoint:
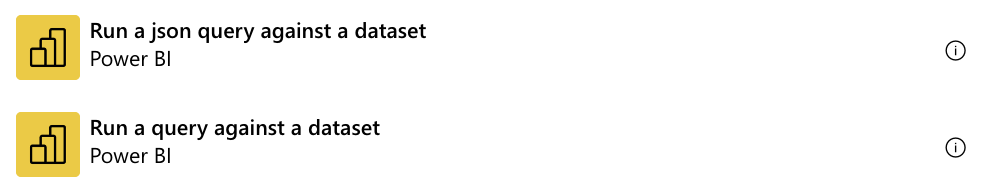 Automate Actions
One is simplified as it will simply receive information, and the other is more complex as it will receive information in JSON format. In this case, we will use the simpler one because the results will be the same.
 Run a Query actions
After testing this query, we get back a very simple result:
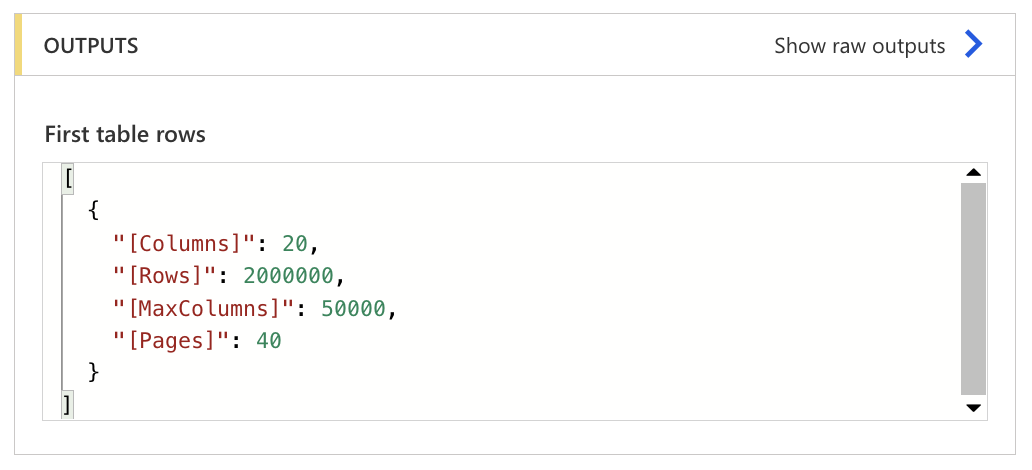 Query output
In it, you can immediately see that because we created our columns, no table name is returned to us! Now the question of how to use this data further is up in the air. We could extract the output for Power Automate purposes using the “Parse JSON” action, but if we only need some specific values, it is possible to use the following code in the “Compose” action:
outputs('{NAME-OF-AUTOMATE-ACTION-TO-GET-PBI-DATA}')?['body/firstTableRows']?[0]?['[{NAME-OF-COLUMN-TO-EXTRACT}]']Which then, when used, will look like this after running the test:
 Compose Action
In the same way, we can extract only the fields we need. Which are “Pages” and “MaxColumns”.
Extracting the dataset
We already have the prerequisites. Now download the data from the dataset! And that’s easy! We will use a Do-Until type cycle, where we will compare some variables, which we will increment in the cycle until it is equal to the number of pages counted.
We create a new action to query the dataset and pass it a simple query like:
VAR _mover = 50000 * 0
EVALUATE
TOPNSKIP ( 50000, _mover, tbl )
After editing within Power Automate, it will look like this:
 Get dataset
Of course, we must not forget that increment:
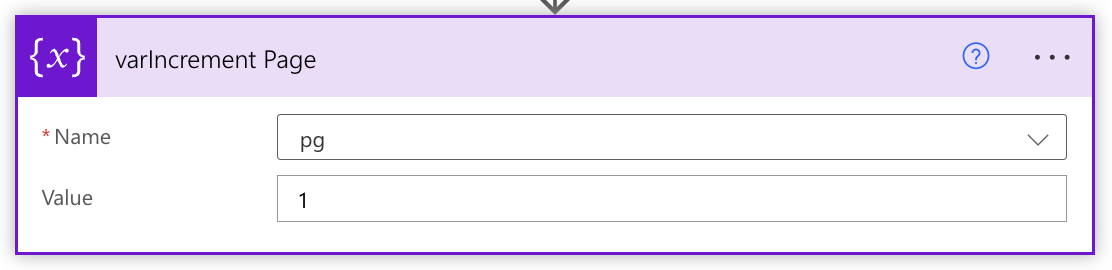 Increment
The whole cycle will then look like this:
 Full Automate
Whether you want to download the data once in a while, automatically, according to some calendar, is entirely up to you—the same as how you deal with the data afterward. For example, you can upload them to some blob storage, which you can then use for other purposes… or to Sharepoint as a CSV file.
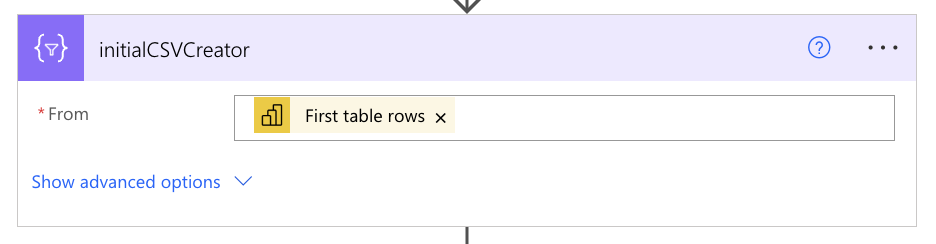 CSV Creator
Final touches
I almost forgot!! When we turn it into CSV because we requested the data directly and did not create any columns, they are all in the original “tableName[columnName]” format to get rid of unwanted labels or “tbl[]” and kept only the column names, so we can add one more compose, which will refer to the output from our initialCSVCreator and use the following code to remove unwanted characters:
replace(replace(body('initialCSVCreator'),'tbl[',''),']','')If you think about it, we referred directly to that table almost everywhere. Of course, we could eliminate that by using some variable within Power Automate, and we would always stick it to the original code. But I’ll leave it up to you how you like it best!
But I have one more little bonus for you. If we didn’t want the data to be returned with the name of the table, we could play a little with the original code to extract the columns:
This code would return a concatenated string containing the new column name and column name with the table, which we could then use for the SELECTCOLUMNS() function to retrieve data from the dataset directly.
 Columns names
Conclusion
This endpoint opens up new possibilities for working with data from Power BI further using other technologies such as Power Automate, Azure Data Factory, or even just Azure SQL Database, thanks to its new REST API calling function. As with any other REST API endpoints, however, you need to follow the rules in the documentation and watch out for the limits! Or be able to bypass them.
And that’s it! I hope you enjoyed this article and that you will find it useful. If you have any questions, please feel free to ask them in the comments below. I will be happy to answer them.

