


Every developer needs to know how measures work, how to optimize them, and how they can be manipulated, even for some visual beautification of the report. However, it seems like it should be completely irrelevant how many of these measures we have in the model, because they are evaluated only when applied to the visual or when another connected measure is invoked. But is that so? NO!
Unfortunately, everything we put into the model has some impact on performance – whether it’s development performance or report usage performance when the model or visualization is loaded. Classically, however, this is why they tend to look at the data as such and at the model so that everything is as it should be. But what if we have a model that is fine, but we have 1000 measures in it? Will they also have any impact on performance? Yes, they will have an impact, not too big, but they will, even if they are not used. And that’s important to realize and stick to the rule: Do more with less.
But how much will our performance deteriorate if we have too many measures?
Preparation of datasets
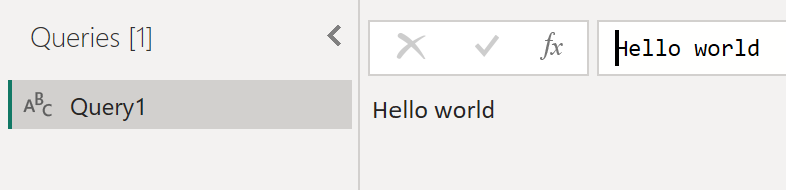
For our tests, I will be using this small file:
 Initial File
The file is very small because it contains only one table in which there is only one column with one row. So we have only one value, “HELLO WORLD.”
 Query in model
But it wouldn’t do us any good empty like this. We still need those measures to test it. Manually creating them would be a waste of time. So let’s use a simple C# script to do this, which can be executed using Tabular Editor:
for(int i = 1; i <= 1000; i++)
{
    var newMeasure = Selected.Table.AddMeasure(
    "MEASURE " + i.ToString(),                    // Name of Measure
    "BLANK()"                                     // DAX expression
    );
    newMeasure.FormatString = "0.00";             // Format string
    newMeasure.Description = "PLACEHOLDER";       // Description
}
This script creates 1000 measures named MEASURE 1, MEASURE 2, MEASURE 3, etc., with a DAX expression of BLANK() and formatting of 0.00. If we would like increase or decrease the quantity of measures, we need to adjust the settings of the FOR loop.
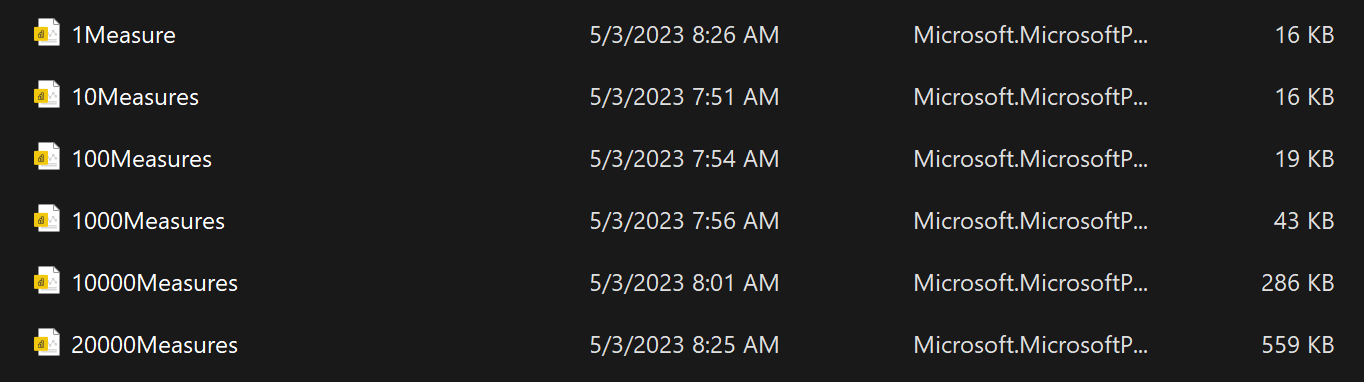
With the help of this script, I created a total of six otherwise identical test files with increasing quantities of measures so that we can examine the performance impact of adding measures to a Power BI data model:
 Created files
Right after their creation, the first influence can be seen, specifically on file size, which is expected because everything has a specific size. And from that point of view, this increase is to be expected. But we have to reckon with it.
Testing Scenarios
It is necessary to define what exactly we will test. I am interested in the following views at the moment:
- Influence on the evaluation of other DAX queries
- On-Premise
- Power BI Service with P1 capacity (via XMLA Endpoint)
- Total speed of these benchmarks
- File speed in Power BI Desktop
- Speed of opening the report in Power BI Service
Influence on the evaluation of other DAX queries
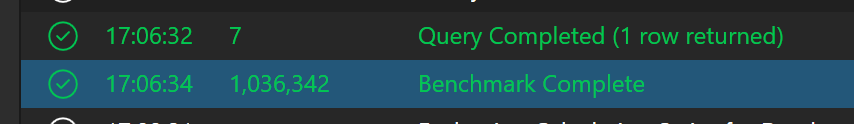
As part of the first Test, I opened each file in Power BI Desktop, opened DAX Studio from the External Tools ribbon, and ran a simple “EVALUATE {1}” test. For it to be a replicable test, I used the “Benchmark” function in DAX Studio, which executes the given expression several times and measures the results. Specifically, I performed 30 tests – half as Cold Cache Executions, and the other half as Warm Cache Executions.
 DAX Studio - Benchmark
I performed the test against the local models and the models in the Power BI Service, which I had published in a Power BI workspace with P1 capacity. So you can find the results here. Unfortunately, against the model with 20000 measures, I tested it only once in the online version!
 DAX Test
BUT BEWARE! I marked the row with 20000 measures. And that’s because I tried to do this test more than once. In total, I performed 75 queries against each model. Or… I tried.
In most cases, when I tried to connect to the model via the XMLA endpoint, the same errors were always returned. Specifically, it was either a timeout or an inability to maintain a connection:
 Time Out Warrning
Regarding the timeout, I set the timeout to occur after 999s.
In terms of capacity utilization, it was also quite an exciting experiment because this one dataset could utilize the CPU capacity by over 100% by trying to query the evaluation of a simple expression.
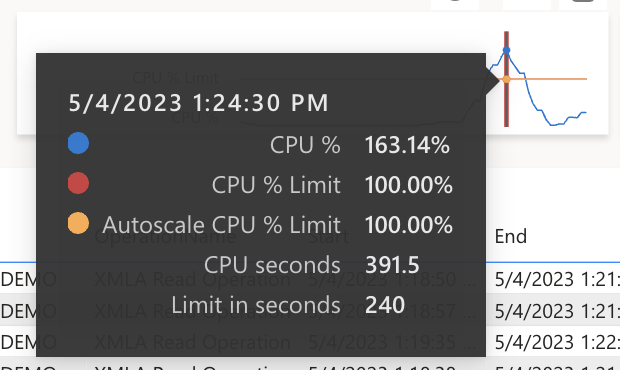 Overloaded capacity
At the same time, within the premium capacity monitoring report, you can see a little more detail, which reveals that the dataset with 10000 measures also took quite a lot of CPU time from the point of view of the XMLA endpoint.
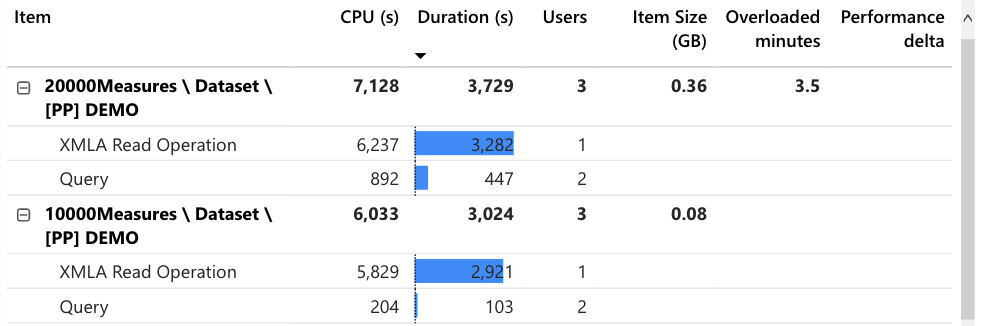 Top two datasets by their XMLA read operations
What could be observed in the tests, however, is that the more measures there were in the model, the longer the entire test took, both in the local and online versions. The impact was high, but I expected it to be higher. What was very interesting to observe was that the evaluation speed of these tests within the COLD Cache increased significantly with a higher number of measures.
 Benchmark speed
This behavior was significantly caused by the fact that the time to delete the cache is included in the total duration of the test. And the time for this deletion grew significantly, from 20ms to 146573ms. And that’s a huge difference.
 Cache deletion time returned by DAX Studio
Thanks to these times needed to wipe the cache, the time needed to perform this benchmark also changed very significantly:
 Full measured time of Benchmarks
So from that point of view, it’s clear that the mere presence of measures in a Power BI data model does indeed have an impact on performance (even if they’re not used at all), and that is why we should try to have only those measures in the model that we NEED. At the same time, it is good to use constructs that allow us to prepare unified procedures that can be directed against existing measures so that we do not have to create extended copies of them. I have in mind, for example, procedures for calculating YoY, MoM, YTD, MTD,… etc. So yes, it is good to use Calculation Groups for this.
But back to the other tests. Does the number of measures in the model also affect the other scenarios I mentioned initially?
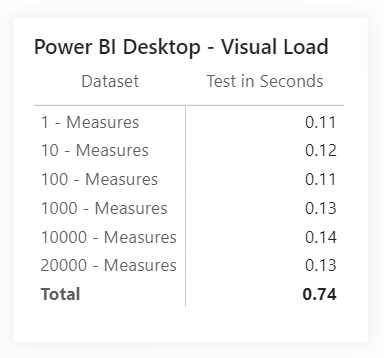
File speed in Power BI Desktop
From a regular developer’s point of view, Power BI Desktop is an essential tool, and we need it to run fast and stable. It has probably happened to you that you opened some “.pbix” file, and everything took a long time to load. Another well-known behavior is that if we want to create a new measure, we wait quite a long time before the field for writing the DAX code appears, then we must wait again when we press Enter to save our measure, and yet again when we save our changes to the .pbix file. But measures they also affect the speed of opening the file? After all, the file with 20000 measures is still tiny, so it should be very quick to open in Power BI Desktop, right?
For all the pre-created files, I did a repeated test by opening them, and measured the time duration from the launch command to loading tables and main icons on the canvas. Without loading these two points, nothing can be created anyway, so the developer would have to wait. Of course, if you have any visuals on the page, the canvas icon will not appear.
 Tracked points
The results of the tests performed are as follows:
 Results of file opening UI tests
I was also interested in how long it would take to do common operations in such a file, like creating a visual (containing nothing), and then the speed of loading the visual using measurements via the Performance analyzer + creating a new measure. For example, I measure the creation of a visual using this criterion: From the time I click to create one of these objects, I measure the time until it is created. I am also interested in the time it will take to save the measure into the model after I confirm its insertion.
Within the performance analyzer, I created one graph on the page, in which I put our one value and a randomly selected one of the measures. Then, I clicked through to the second blank page, where I started the analysis and moved between pages. Turned analysis off. I performed this experiment five times, and averaged the results:
 Performance analyzer results
This result surprised me but made me very happy. From the values, after the file is opened, the number of measures does not affect the performance of the visuals.
Regarding the measure creation speed test, I specifically measured the time when the Power BI Desktop client is unusable because it is blocked by this message:
 Wokring on it
Results of test:
 Speed of creating a new measure
The results show that when there are 10000 measures, working with Power BI Desktop becomes problematic, because everything starts to take much longer, and it only gets worse with 20000 measures. However, working with such models could be more pleasant with external tools.
For example, working with Tabular Editor (TE) as a peek into the active Analysis Services was much more stable, even with a higher number of measures. I attribute this to Power BI Desktop triggering a check of all existing measures when creating a single new measure. In addition, TE has the advantage of allowing us to prepare all the necessary changes/additions, etc., in advance and then deploy them simultaneously.
Again, I am returning to my statement from the last part of the article and expanding a little on the statement. The influence of the measures present in the model is considerable, on both the model and the user experience within Power BI Desktop. Less is more! According to these measurements, we should ALWAYS keep only the measures we use or explicitly need in the model. It is possible to reveal a pattern in the individual measures that the individual measures have in common. In that case, using the Calculation Item, which will carry this pattern, will be better. YES! Calculation Groups can have a rather unpleasant impact on the Self-Service environment, but that is only about educating the report creators so that they learn how to work with them and use ready-made constructs. And for deploying multiple objects simultaneously, you can use Tabular Editor, for example, so that you don’t have to wait for all measures to be verified every time you add a new measure.
But we don’t stop here! The user view remains to be seen. So up to the heavens… Power BI Service, what are you hiding from us?
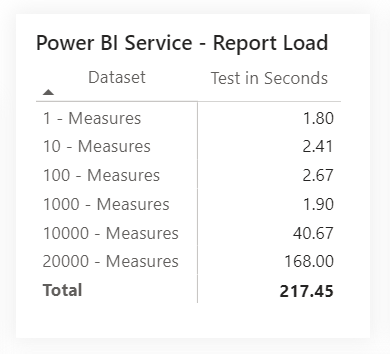
Opening speed of the report in Power BI Service
The scenario is simple. I am a user and want to see a report that someone has prepared for me. So I will, click on the report, it will load quickly (including the content), and I will get the answers I came for. Simple. Why would we go to the report otherwise? Let’s add one variable here. What does “fast load” mean? This depends on the subjective perception of each of us, and it isn’t easy to define objectively. Power BI report users tend to think of their reports as being web pages, and in the abstract, they’re right. But this oversimplification comes with a potential risk: If our reports take more than a few seconds to load, the users are very likely to do the same thing they would do on any other web page: Get frustrated, close the tab in their browser, and possibly never come back. Needless to say, this would be a terrible outcome for the business, because it would mean that those users are no longer making their important business decisions based on reliable, certified data and reports, but rather on their own ad-hoc reports in Excel, or worse, their gut feelings! Therefore, we must always ensure that our reports load quickly in the Power BI Service.
We also have the advantage of measuring precisely how long the report takes to load. We can use DEV Tools a feature available in all modern browsers) to accomplish this task. You can access DEV Tools using the F12 key in Chromium-based browsers (e.g. Google Chrome, Microsoft Edge, Opera, etc.) and Firefox-based browsers (Firefox, Waterfox, Tor Browser, etc.). Within them, switching to the NETWORK tab is necessary, where we can measure how the individual communication between us and the given page takes place. When we query a page, we expect something to return. Rendering the page is a communication between the server and us when the server sends us the individual parts from which the page is rendered. During the tests, I noticed that before the report, is rendered, a “Pre-load” of the conceptual scheme occurs, which contains settings, tables, columns, measures… etc.
 Loading Report
The query for this pre-load is labeled “conceptualschema,” and before it is evaluated, you can find a message like in previous picture instead of your report:
 Recieved Conceptual Schema
I’ll give one warning… BEWARE OF THE CACHE!!! It can significantly distort your results and cause the report to avoid getting stuck in this section again, for example, for a given day, even for a second. But I ran the test through this console against all the tested files within the P1 capacity:
 Report loading results
The resulting speed can also be affected by the internet connection, specifically its fluctuation and speed, but the results are self-explanatory in any case considering the question we are investigating. The loading of the input query, which prevents the loading of the rest of the report, increases significantly with the increasing number of measures. According to these six examined files, 1000 measures do not have a high impact on the speed of setting up the report, but 10000 measures have a significant effect. Not to mention 20000…
SUMMARY
Measures are a treasure and can solve our calculations at breakneck speeds. But we should make them for specific purposes and not because “they might be useful in the future.” Their high number can negatively affect the overall experience of both developers and Power BI users, which would be a great shame!
It is not a good idea to make duplicates of individual measures, neither for the sake of archiving changes nor for placing them in multiple Measure Folders. For archiving changes, it is better to use, for example, pbi-tools and versioning within GIT repositories as TMDL files. It is better to place one measure in multiple Measure Folders using the character “;” in the folder name field, as a delimiter between multiple folder names. The measure will be displayed in every specified folder, but will only exist once in the model!
If we have a procedure that is repeated or reused in many different measures, it is a good idea to use Calculation Groups and train users to work with them. Yes, many developers fear Calculation Groups or argue that they cannot be formatted using conditional formatting, but this is not true.
I don’t need to add anything more… #CountOfMeasuresMatters!

