


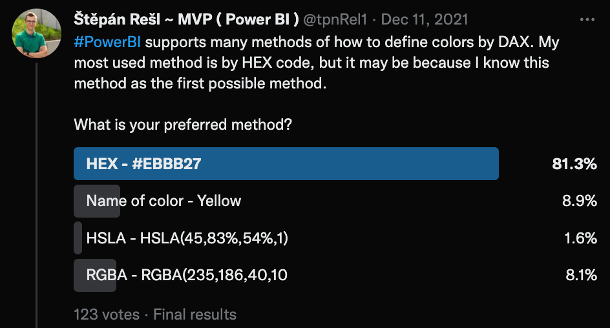
Almost a year ago, I asked on Twitter what color format you use in Power BI. The results from that question weren’t all that surprising.
 Twitter poll results
Why? Because almost everyone knows the HEX code, and we use it very often, it is easy to write, and most systems require it to define a color. Next, the RGB / RGBA code and name definition of the color were placed. However, HSL or the HSV alternative only appeared a little in the answers. For that reason, I am introducing you to this color notation and showing you how practical it can be.
Intro to HSL color code
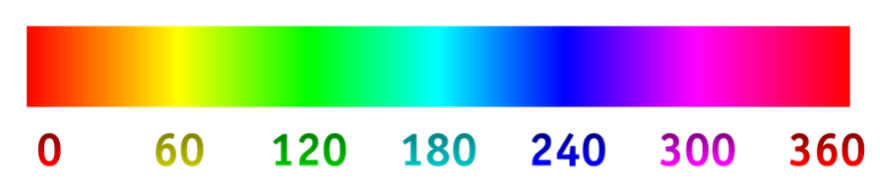
The HSL and HSV color code is based on the Hue of the color, which is defined by the rotation along the color axis. So it starts at 0° and ends at 360°. In both cases, it is red, according to the following image.
 Color Ratio
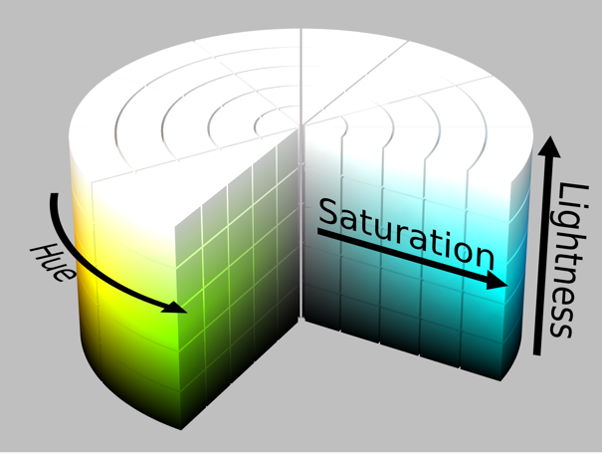
Furthermore, color saturation essentially defines color as its brightness. These are the parts that HSL and HVS have in common. These color definitions then differ in the final letter, which in HSL or L means Lightness, and in HSV or V means Value.
I work more often, even in my imagination, with the HSL variant because the higher the Lightness value I set (up to 100 %), the more the color will fade and come closer to white. This can also be seen quite well in the following picture.
 Color cilinder
HSL in Power BI
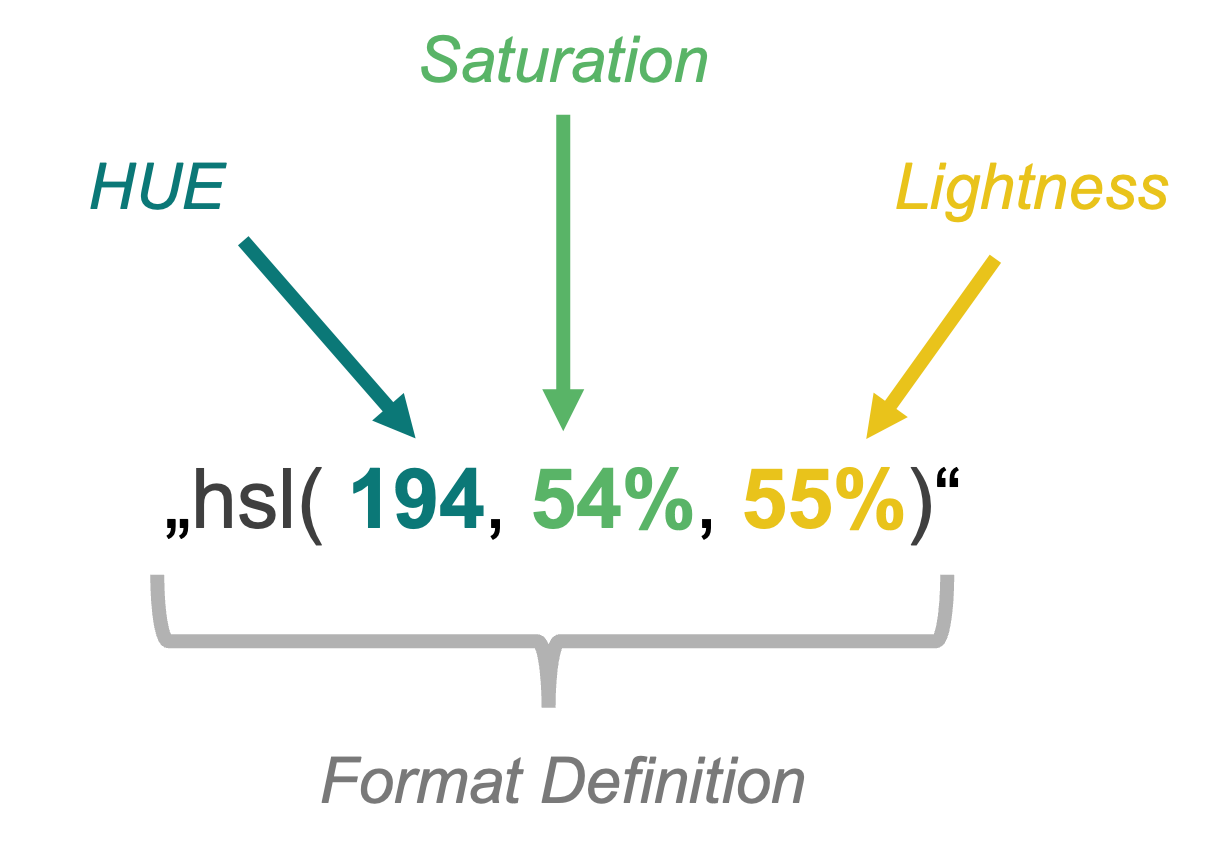
As already mentioned, Power BI supports many color formats, but you must know how to pass them to the background algorithm. So, if you ever want to use it, HSL, like other formats, is passed as text, so in double quotes and the inner part of the text looks like this:
 Format definition
This notation results in this color:
 Result color
Its HEX code would be “#4EADCA”
Using HSL only for the definition of one color would indeed be pointless, even from the point of view of writing the necessary characters. However, the beauty of this coding (at least for me) is that it is enough to define the base color using HS and L to be used only and only for its modification. So, for example, for GRADIENT.
The gradient in Power BI
Single-color or Double-color gradient is natively supported as part of conditional formatting, for example, for the color of columns in a bar chart or the background of a column within a matrix. At that moment, Power BI recalculates the individual points in the chart and distributes the color among the selected ones. (From the color of the Highest value to the color of the Lowest value)
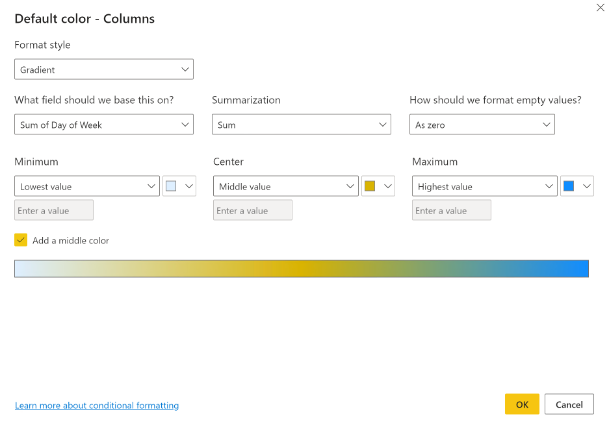 Gradient settings
This is something we can arrange ourselves in the code. It doesn’t matter what color code we choose for it because it will only be the one that works best for us. As I mentioned before, HSL suits me very well for this purpose.
Single-color gradient by HSL
Power BI UI doesn’t accept HSL encoding, and so…
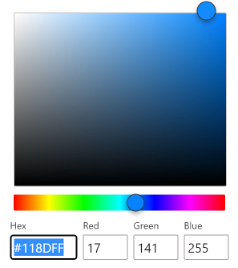 Power BI Color selecting UI
Where UI doesn’t help, DAX has to come into play. Let’s say we’re trying to get the following result, but DAX will calculate the color:
 Native gradient
To get to that, we need to know the model we will demonstrate. In this case, we only have two tables. Dimension “priceList” and Fact Table “Sales.” Between them is a 1:* relation over the [id] and [idProduct] columns.
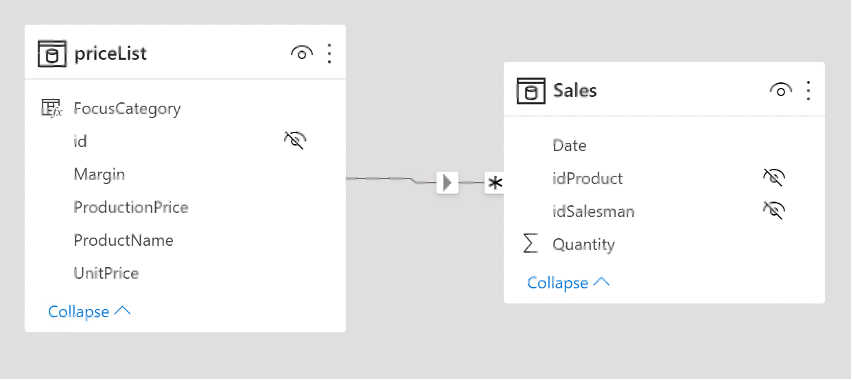 Relationships
I will create a matrix from these tables representing the basis on which we will place the gradient we wrote.
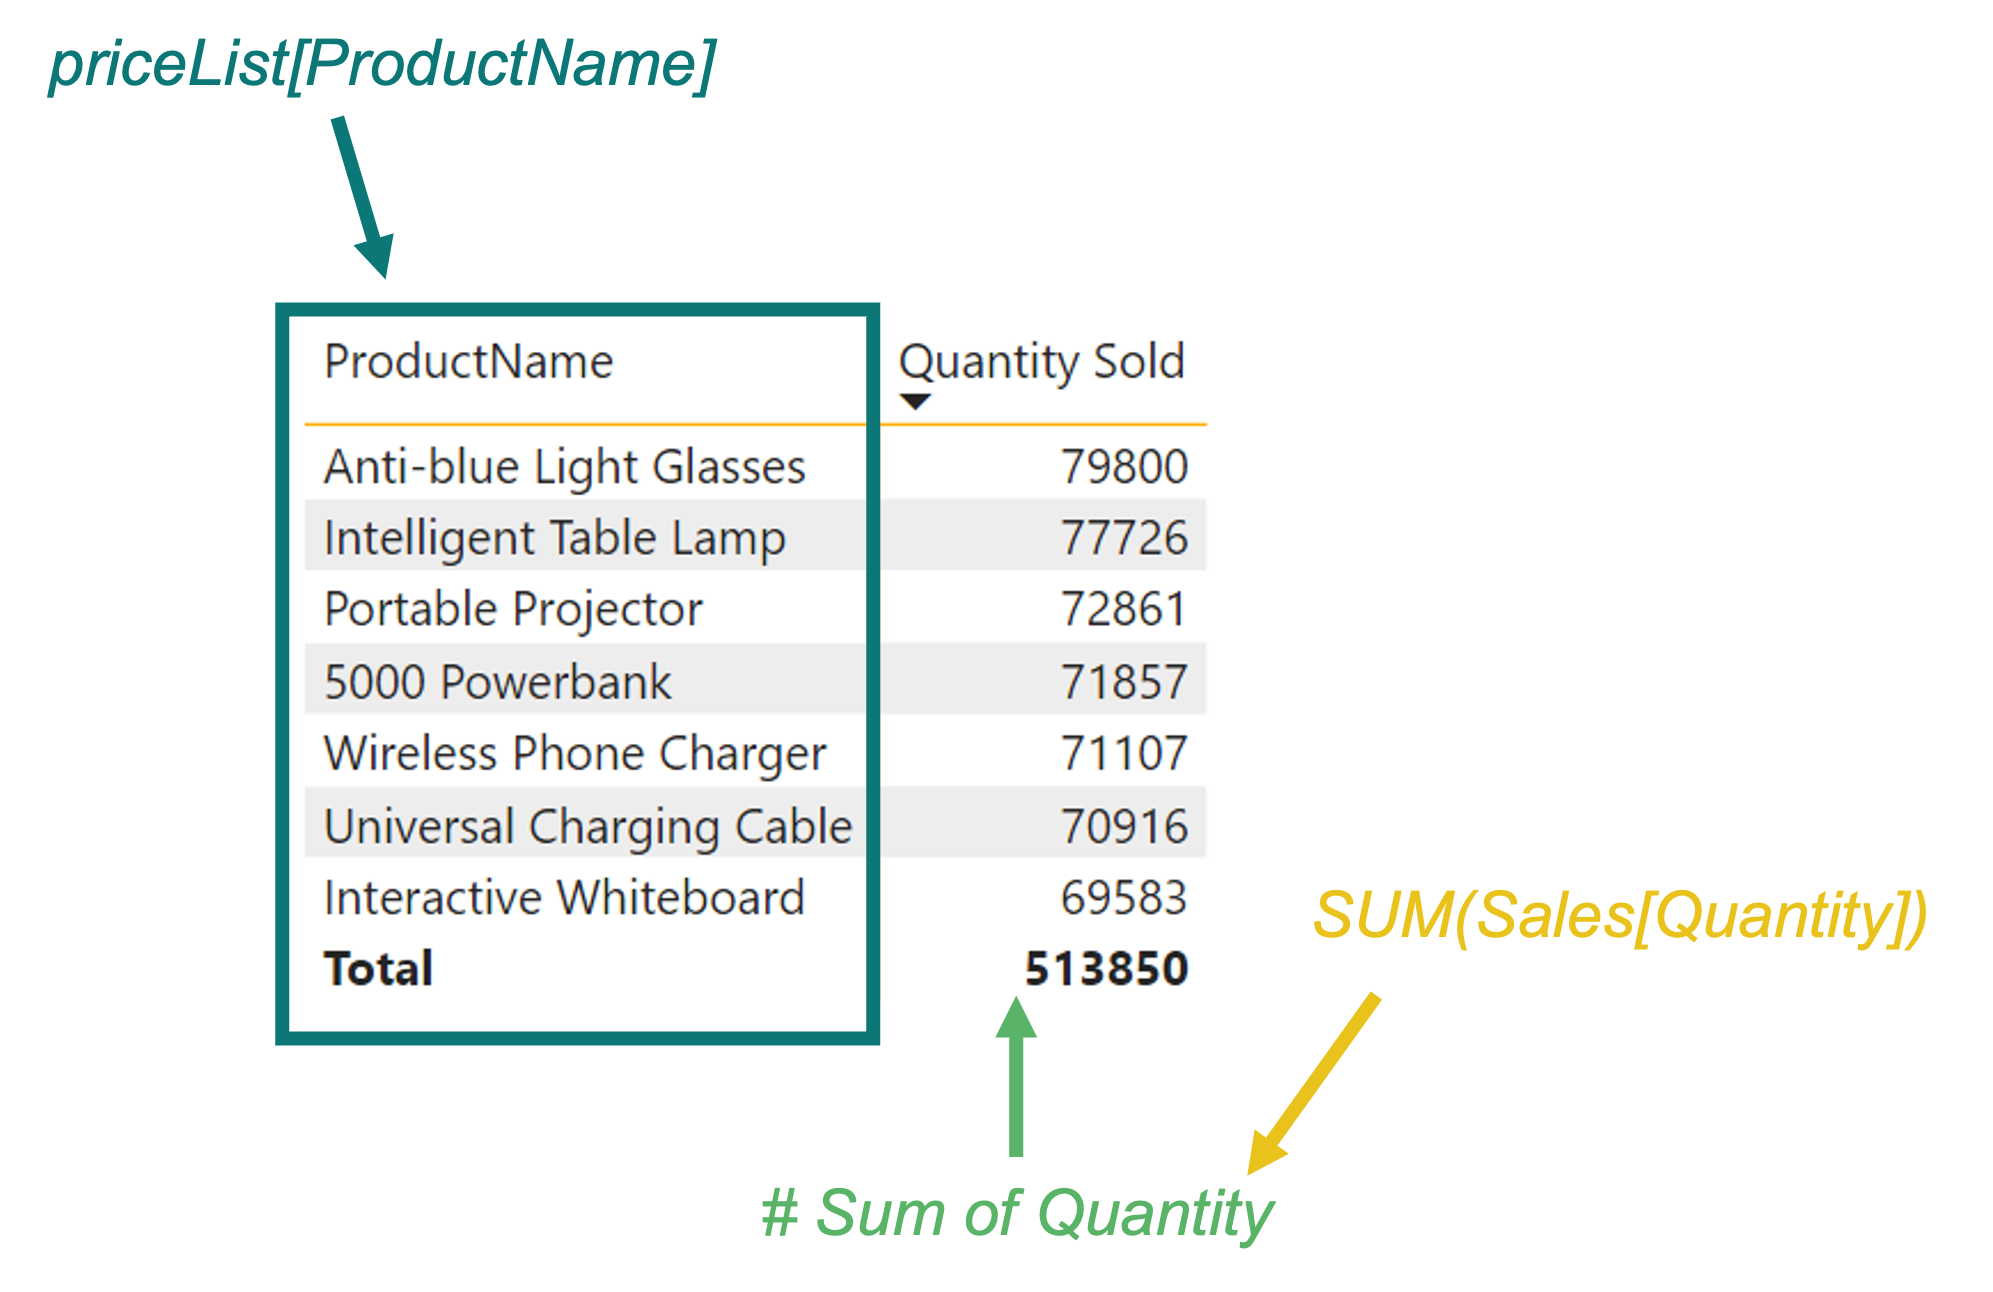 Description of calculation
A minor consideration before we even start creating the gradient. Gradients can be implemented in different ways. But mostly, we need to think about what we are trying to say with it. Because we only sometimes want to highlight all values. Sometimes we only need the first ten values, those above the media, or the percentile 50. Likewise, sometimes we can get to a variant where we don’t even want to solve the percentile distribution but everything above the average. In the same way, you may want to “just” use color to show that the results are decreasing and not to decide by how much.
So we have many options. Let’s try to create one of them. Which one? The last one! That is when we don’t decide how much there was a decrease or increase, but when we have to sort all the results and find out how much the current value is, to assign it to color in the fading spectrum according to this order.
So the first thing we’ll start with is choosing our starting color, which will lighten up to completely white. It will be the color with the HEX code “#FFAC00”. For example, I will convert the color using this converter: LINK.
The output of the conversion will look like this:
 Converter output
We need to wrap in the previously mentioned format: “hsl(40,100%,50%)”.
I can start using it right away in Power BI. But to check it, I’ll create a measure called “Single-Color Gradient.”
VAR _initColor = "hsl(40,100%,50%)" RETURN _initColor
If I place this measure in the mentioned matrix and set the conditional formatting of the [Quantity Sold] column to be based on this measure, the result will look like this.
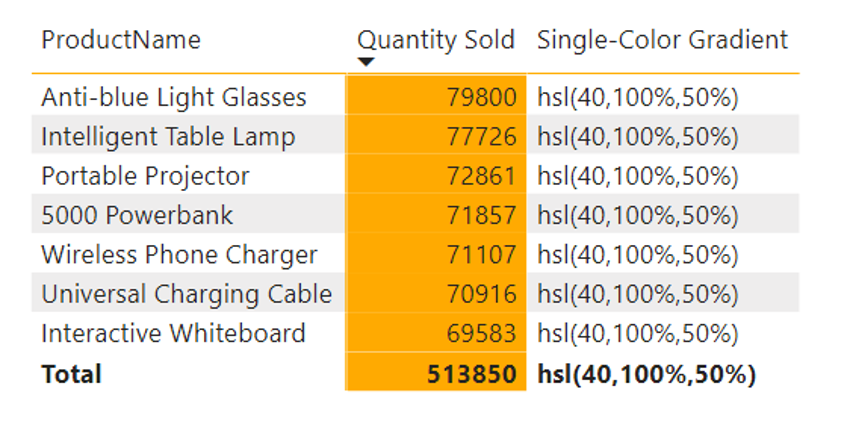 Color by HSL format in Matrix
So I see that each line contains the same value, and the “orange” one is rendered as a background very well, even from the HSL color code. So we can start from that. Also, I will leave the column showing the results in the matrix for easier understanding. What is necessary now is to add a calculation that returns a value between 0% (respectively 50%) and 100% for lightness to let the color fade to white.
To follow the mentioned scenario for the gradient, I reach for a function that can return the order of the elements based on their results for the given set. As you probably guessed correctly, I’m talking about the RANKX() function.
How do you think you could use it? Well, from the point of view of the procedure, you need to know some essential data we need for the calculation.
- Initial lightness
- The total number of rows of the matrix
- The value of each row
How to get them? Point No. 1 is clear. We already have that one. To get the answer to point #2, we can use COUTROWS() directed at the “priceList” dimension. Finally, point No. 3 can be obtained by ADDCOLUMNS(). The result of this ADDCOLUMNS() is something on which we can use our RANKX() function to return ranks on calculated results. These results are usable as multiplicators for… let’s call it as LightnessMover, shall we? It is a value calculated like a subtraction between maximal potential lightness (100) and the original lightness of our selected color (50), divided by the count of rows in the matrix.
After a bit of modification, the function will look like this:
VAR _selectedValue =
SELECTEDVALUE ( 'priceList'[Id] )
VAR _inputTable =
CALCULATETABLE ( DISTINCT ( 'priceList'[id] ), ALLSELECTED ( 'priceList' ) )
VAR _counter =
COUNTROWS ( _inputTable ) - 1
VAR _rankOfRow =
MINX (
FILTER (
ADDCOLUMNS (
_inputTable,
"@rank",
RANKX ( ALLSELECTED ( 'priceList' ), CALCULATE ( [# Sum Of Quantity] ),, DESC ) - 1
),
[Id] = _selectedValue
),
[@rank]
)
VAR _lightness =
VAR _initialLightness = 0.5
VAR _maxLightness = 1
VAR _lightnessMover =
DIVIDE ( ( _maxLightness - _initialLightness ), _counter )
RETURN
FORMAT ( _initialLightness + ( _lightnessMover * _rankOfRow ), "#%" )
VAR _colorDefinition =
VAR _hue = "40"
VAR _saturation = "100"
RETURN
"hsl(" & _hue & "," & _saturation & "%," & _lightness & ")"
RETURN
_colorDefinition
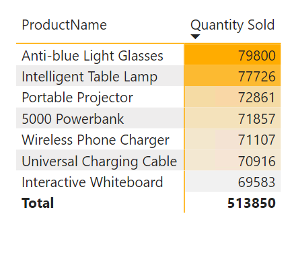
Result matrix:
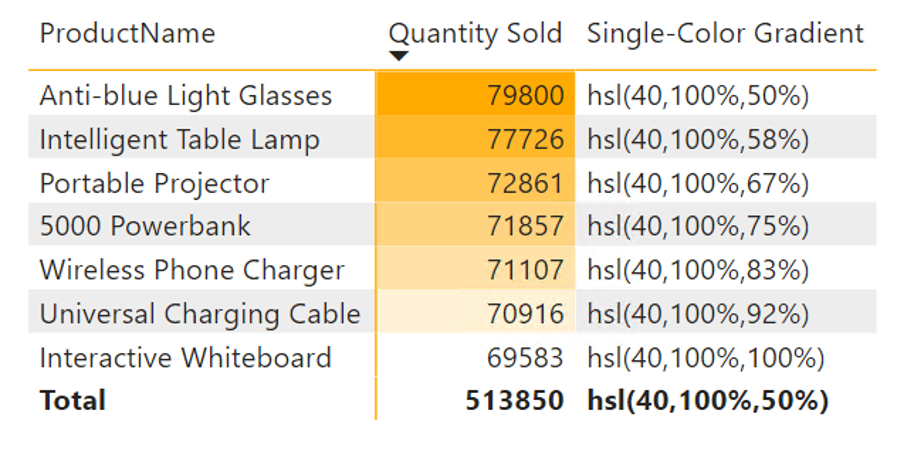 Custom single color gradient
Cool, isn’t it? But do you know what would be even more fabulous? If we could make it more dynamic, we wouldn’t need to reference exact measures inside that RANKX. Luckily we can use this expression also in Calculation Groups with SELECTEDMEASURE().
Multi-color gradient
Ok… Let’s go to what I promised in the title of this article. Once we got the Single-Color version of this gradient, we had more challenging parts already solved. Why? Because now, we need to be able to switch HUE and SATURATION when we need it.
So let’s say that the products in said matrix belong to one of two categories. Either they have priority and should be sold, or they don’t have priority. That’s something that you can see in this image in column [FocusCategory]:
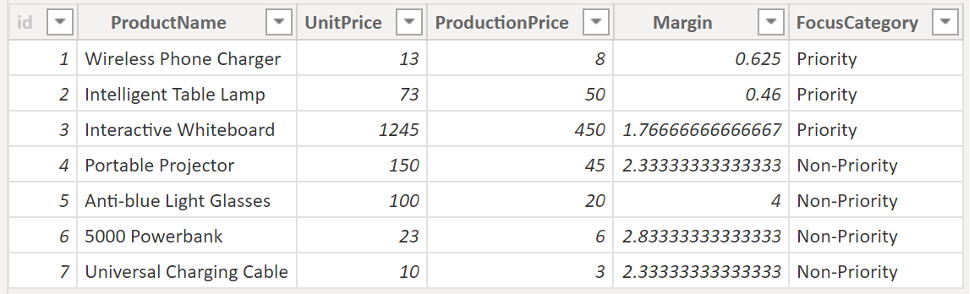 Pricelist details
I want to use a different base color depending on the product category. For example, the priority category will be green, and the non-priority category will be blue. Since we have the algorithm ready, it’s just a tiny adjustment to solve this condition:
VAR _selectedValue =
SELECTEDVALUE ( 'priceList'[Id] )
VAR _selectedCategory =
SELECTEDVALUE ( 'pricelist'[FocusCategory] )
VAR _inputTable =
CALCULATETABLE ( DISTINCT ( 'priceList'[id] ), ALLSELECTED ( 'priceList' ) )
VAR _counter =
COUNTROWS ( _inputTable ) - 1
VAR _rankOfRow =
MINX (
FILTER (
ADDCOLUMNS (
_inputTable,
"@rank",
RANKX ( ALLSELECTED ( 'priceList' ), CALCULATE ( [# Sum Of Quantity] ),, DESC ) - 1
),
[Id] = _selectedValue
),
[@rank]
)
VAR _lightness =
VAR _initialLightness = 0.33
VAR _maxLightness = 1
VAR _lightnessMover =
DIVIDE ( ( _maxLightness - _initialLightness ), _counter )
RETURN
FORMAT ( _initialLightness + ( _lightnessMover * _rankOfRow ), "#%" )
VAR _green =
VAR _hue = "113"
VAR _saturation = "48%"
RETURN
"hsl(" & _hue & "," & _saturation & "," & _lightness & ")"
VAR _blue =
VAR _hue = "194"
VAR _saturation = "54%"
RETURN
"hsl(" & _hue & "," & _saturation & "," & _lightness & ")"
RETURN
SWITCH (
TRUE (),
_selectedCategory = "Priority", _green,
_selectedCategory = "Non-Priority", _blue,
BLANK ()
)
Minor adjustments like adding SELECTEDVALUE() to the category column, color definition, and SWITCH() at the end can do wonders because the resulting table will begin to be subject to a gradient defined by us, which, in addition to one color, dynamically switches between other colors. We can add as many of them as we need with a similar modification.
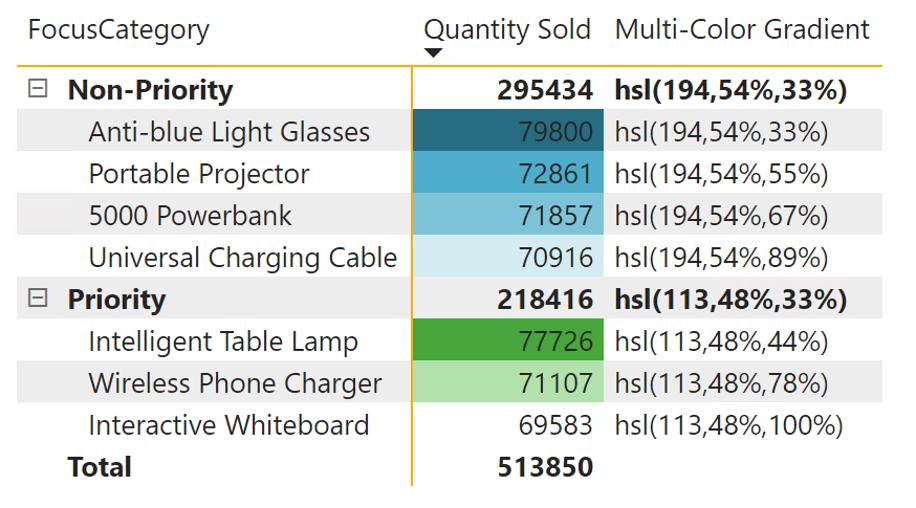 Multicolor Gradient in Categories
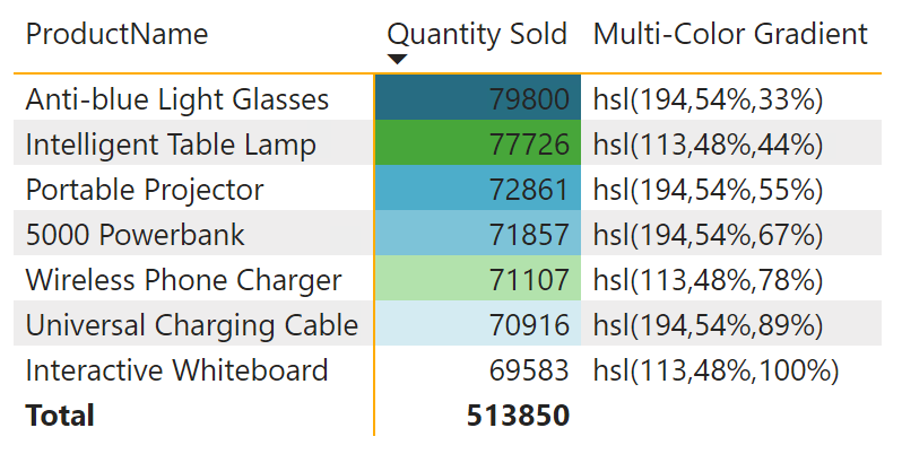 Multicolor Gradient without Categories
We could even add other conditions and points of view that we would like to include in the calculation.
Summary
A custom gradient can come in handy in many scenarios where you want to add weight to specific results or sets or add another visual dimension to values. When combined with DAX, anything can be achieved.
I hope this article has shown you that you don’t need to use the HEX color code for everything and that there are more similar codes, such as the HSL above, HSV, and RGB, and it’s up to you which one you use.
It is certainly worth noting that HSL has its HSLA variant, supporting transparency as part of its last attribute.
The code I have shown here can be further modified and even more generalized using, for example, Calculation Groups and Field parameters.
In closing, I’ll leave you with a few questions:
- What do you think about gradients?
- Do you use them?