Conditional formatting is one of the basic building blocks in preparing Power BI Reports. Especially if we want to reduce the time for users to get the answers they came to the report for. But how about conditional formatting when we use field parameters in our model?
This article follows from the previous article: Field parameters in cooperation with Calculation groups – I use the same dataset in this article.
Conditional Formatting with Field Parameters
Field parameters are tricky in how they are executed. I can either deal with their output or input from a formatting perspective. It sounds rather abstract, but practically it means that I can either look directly into the “return” table of the field parameter or up to the table that is the resulting composition.
I have this table, which is composed of a field of dimensions (field parameter {Product name, Employee, Location}) and one Measure:
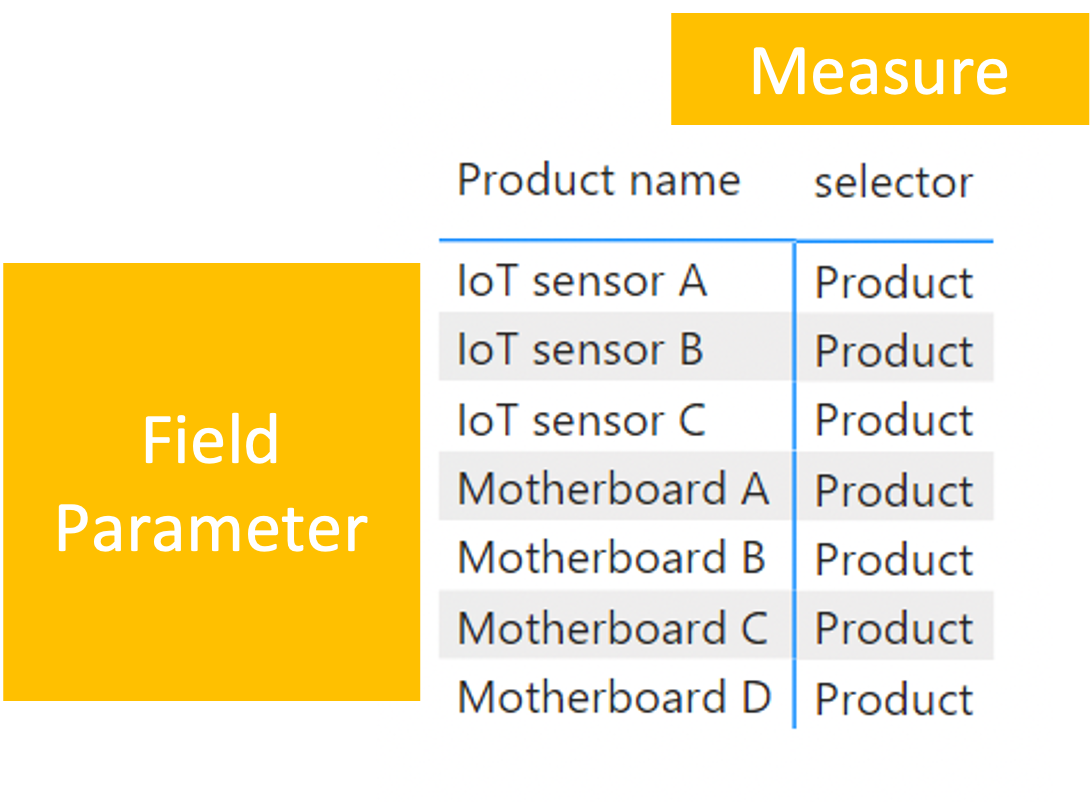 Field parameter in Matrix
The Measure used in the table looks like this:
SWITCH (
TRUE (),
ISINSCOPE ( FieldParameterWithDynamicGrouping[FieldParameterWithDynamicGrouping Fields] ), "Field",
ISINSCOPE ( Products[Product name] ), "Product",
ISINSCOPE ( Employees[Location] ), "Location",
ISINSCOPE ( Employees[Employee] ), "Employee",
"NOPE"
)
From its output directly in the table, it can be seen that the output of the table is directly subject to the resulting composition because the ISINSCOPE() function does not identify the Field Parameter, which is also part of the return options, but only the result. Therefore, the performance Analyzer can answer if this assumption is correct.
Performance Analyzer DAX Queries of this table:
- Direct return of Field parameter:
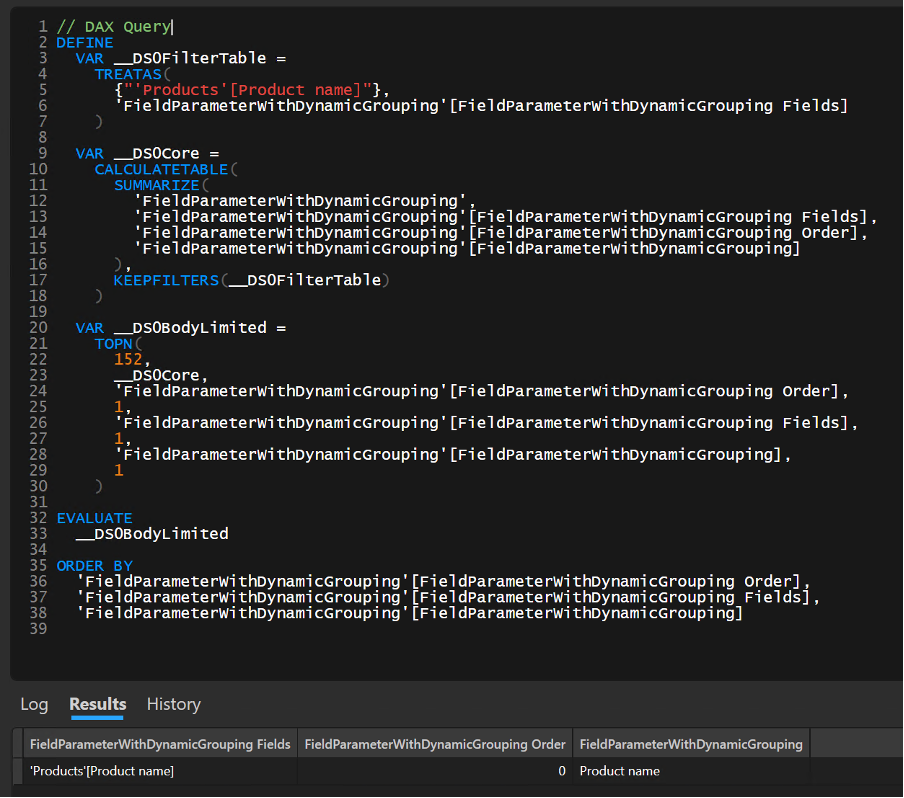 DAX Query in DAX Studio
- Resulted composition:
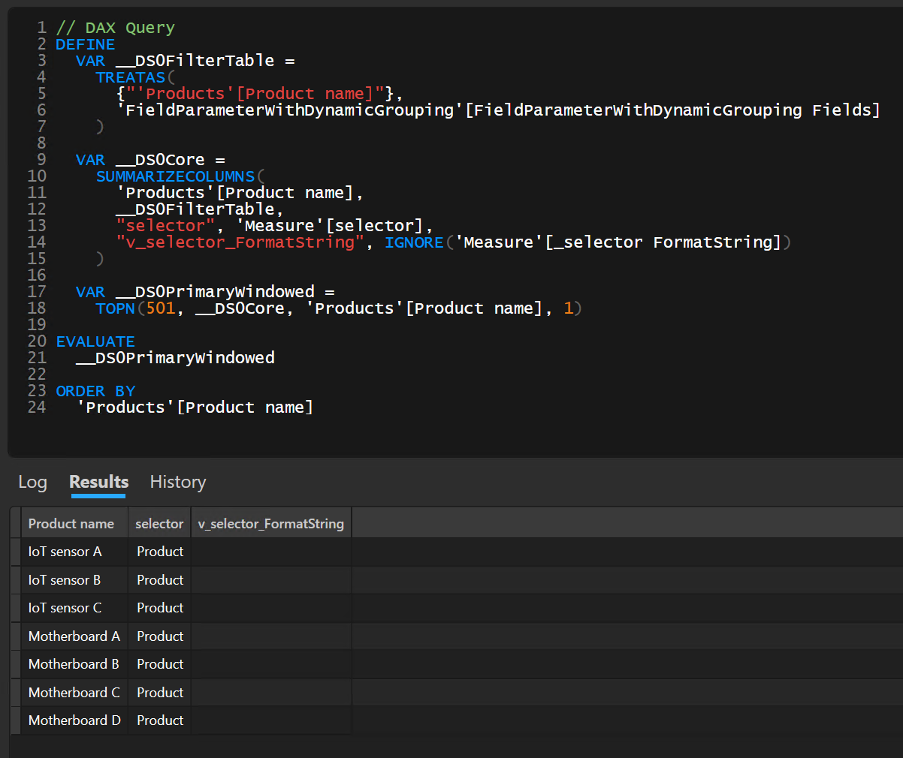 Resulted Composition in DAX Studio
The results are precise. I could still use both variants for conditional formatting. In the case of conditional formatting, I can use any of these outputs. So it is just on me If I will use direct results of Field Parameters or results of a final query. According to my choice, there would be different options for accessing conditional formatting. But which one to choose is a question of purpose and what we are trying to achieve.
So it will be good to set a goal that I am trying to achieve with conditional formatting.
Single-Selection Scenario
Based on the field parameter, I want to color the background of the cells.
Where:
- Product name = Yellow,
- Employee = Green,
- Location = Blue.
This scenario can then be reused so that the entire report page is always colored according to the selected parameter. So if we are talking about the fact that the Field Parameter is within the Single Selection, then there is no problem for this scenario, and the result can look, for example, as follows:
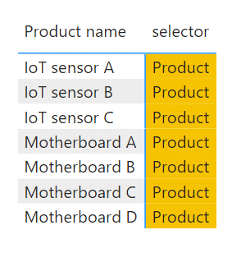 Single Color
I could still achieve this result using both of the mentioned options. But for this time, I will go the route of using only the resulting query. In that case measure for conditional formatting can look like this:
SWITCH (
TRUE (),
ISINSCOPE ( Products[Product name] ), "#F6C300",
ISINSCOPE ( Employees[Location] ), "#0C4B5D",
ISINSCOPE ( Employees[Employee] ), "#5BAC58",
"#F6F6F6"
)
So the conditional formatting requirement will need to be extended to make the output less trivial. So let’s say that if the Product ends with the letter A, it will be a dark yellow color; if it ends with B, it will be light yellow and otherwise white.
A minor metric adjustment and everything still runs as it should:
SWITCH (
TRUE (),
ISINSCOPE ( Products[Product name] ),
VAR _lastLetter =
RIGHT ( SELECTEDVALUE ( Products[Product name] ), 1 )
RETURN
SWITCH (
TRUE (),
_lastLetter = "A", "#F6C300",
_lastLetter = "B", "#F8EAB9",
"#FFFFFF"
),
ISINSCOPE ( Employees[Location] ), "#0C4B5D",
ISINSCOPE ( Employees[Employee] ), "#5BAC58",
"#F6F6F6"
)
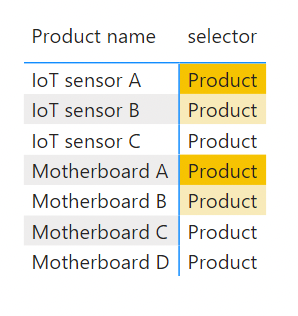 Single color gradient
SELECTEDVALUE() seems to be nicely able to return the value from the returned column from the field parameter, so there is no snag.
Will this work with Multi-Selection?
Here comes the turning point where the fun stops. Why? Because we are in a hierarchy. In addition, a dynamic hierarchy is so dynamic that the same object can sometimes be in the first place, sometimes in the last place—depending on how the user makes up his mind. So how does the current measure fare against such a challenge… poorly.
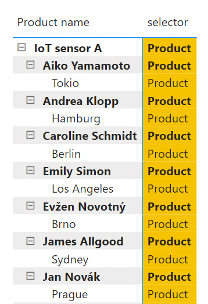 Expanded Matrix
All categories are yellow. But the question remains “Why?”. Simply. The ISINSCOPE() function returns TRUE() for the “Product name” column, even if it just evaluates a value that at first glance looks like a value from the “Employee” or “Location” column. This is because the array stacks value next to each other within the query and do so in a cascading manner. See the following image:
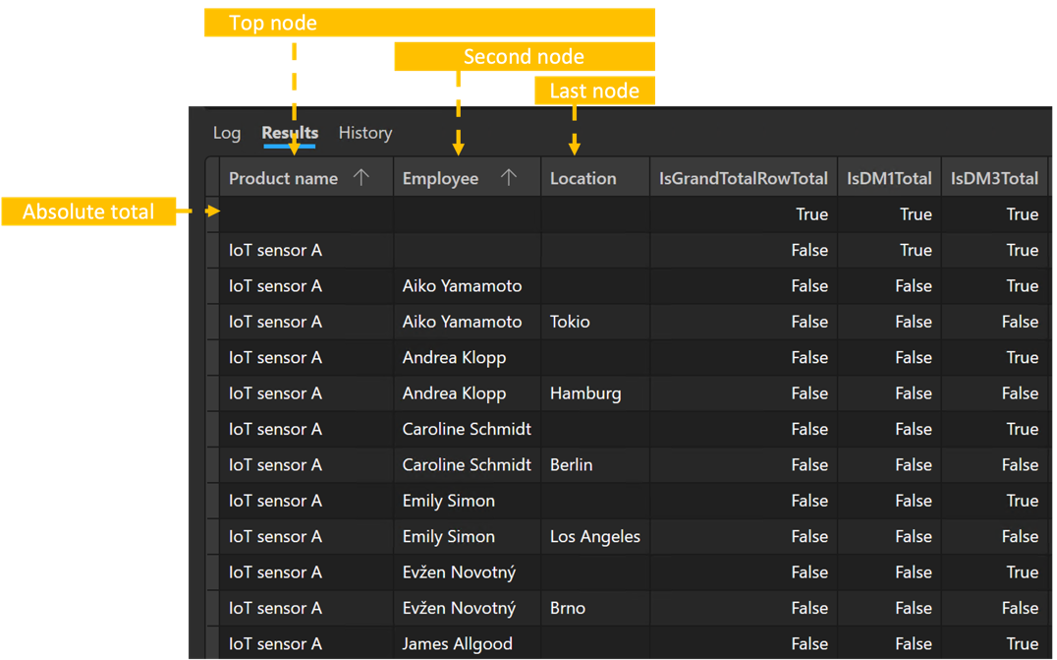 Node system of Matrix
So it is true that even if I evaluate the second node, the top node’s second column contains a value. Therefore, TRUE() is also returned. Therefore finding the column’s name, the current node, is quite challenging. At first glance, it might help if we looked at the Field Parameter in the “Order” column.
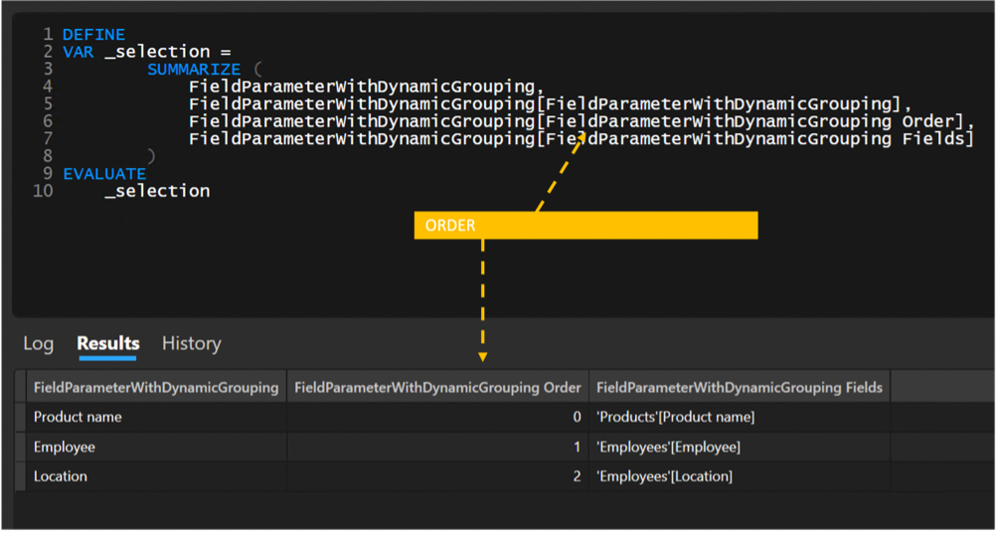 Order column in Field Parameter
But be careful! This column is STATIC! So it is not calculated according to the returned values, which can be confusing. Mainly when the order within this hierarchy depends on the user’s choice.
Fortunately, there are few scenarios for a multi-dimensional field parameter where the user should be able to choose the order of the dimensions and still have conditional formatting tied to a specific field. However, there are more scenarios when we need to solve the degree of immersion of nodes.
Multi-Selection Scenario
One such scenario might be that I want to adjust the color of the matrix based on the sink of the node.
The total will be the darkest color. All other nodes will be colored using a shader. The lowest node will then be pure white. This color scheme can help users quickly understand that this is a parent level and that it is, for example, summing aggregates.
To calculate the current order of the current node, we can again use the ISINSCOPE() function. Specifically by counting the number of positive responses for individual possible nodes. For example, this can be achieved with this option:
VAR _fields =
FILTER (
{
ISINSCOPE ( Products[Product name] ),
ISINSCOPE ( Employees[Employee] ),
ISINSCOPE ( Employees[Location] )
},
[value]
)
RETURN
COALESCE ( COUNTROWS ( _fields ), 0 )
It may be obvious to some, but I’d point out that Power BI uses the [Value] column name as the default column name. Therefore, we do not define any column name. However, in the field, we defined it with the ISINSCOPE() function, so “Value” will be used natively for its name.
Thus, the function from the matrix view will return the exact number, as can be seen in the following image:
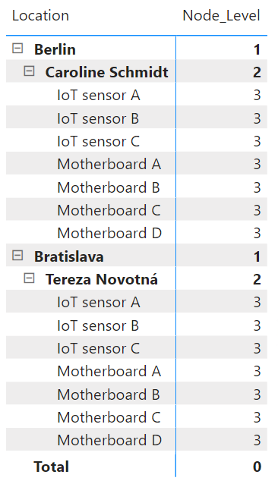 Node level in Matrix
Now it would like to prepare conditional formatting in a similar pattern that will fulfill the original scenario. Since I am talking about dark colors in the script, it must be taken into account that the font should also be able to change the color of the text to white from a particular shade to maintain visibility.
VAR _node = [Node_Level]
RETURN
SWITCH (
TRUE (),
_node = 3, "#FFFFFF",
_node = 2, "#C1C2C7",
_node = 1, "#55565E",
"#242424"
)
VAR _node = [Node_Level]
RETURN
SWITCH ( TRUE (), _node < 2, "#FFFFFF", "#000000" )
Thanks to them, the output will then look like this:
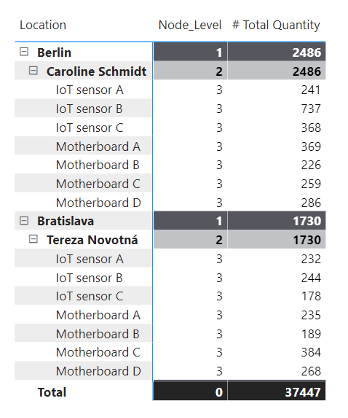 Highlighted nodes in Matrix
Similarly, preparing a slicer with a separate table would be possible, allowing the user to highlight the set that interests him.
Another variant for multi-selection scenarios can be specific conditional formatting, which can only be displayed if it is a combination of specific fields. For such a scenario, you can then reach for the return value from the field parameters:
VAR _selection =
SELECTCOLUMNS (
SUMMARIZE (
FieldParameterWithDynamicGroupingOfDimensions,
FieldParameterWithDynamicGroupingOfDimensions[ParamterOfDimensions],
FieldParameterWithDynamicGroupingOfDimensions[Parameter2 Fields]
),
FieldParameterWithDynamicGroupingOfDimensions[ParamterOfDimensions]
)
...
(Referencing Using SELECTEDVALUE with Fields Parameters in Power BI - SQLBI)
Summary
In summary, I would like to say that Field Parameters are a great thing that makes much work more accessible. That is, if it is not about more dynamic formatting, that should depend on the selected fields from the parameter. Then they add much work. If we were to talk about conditional formatting based on the resulting value, it is the same as with almost any conditional formatting, so it’s pretty cool. The tool from which the images are taken is DAX Studio [(DAX Studio | DAX Studio)](https://daxstudio.org/).
The following Article is Conditional on Formatting with Calculation Groups.


