


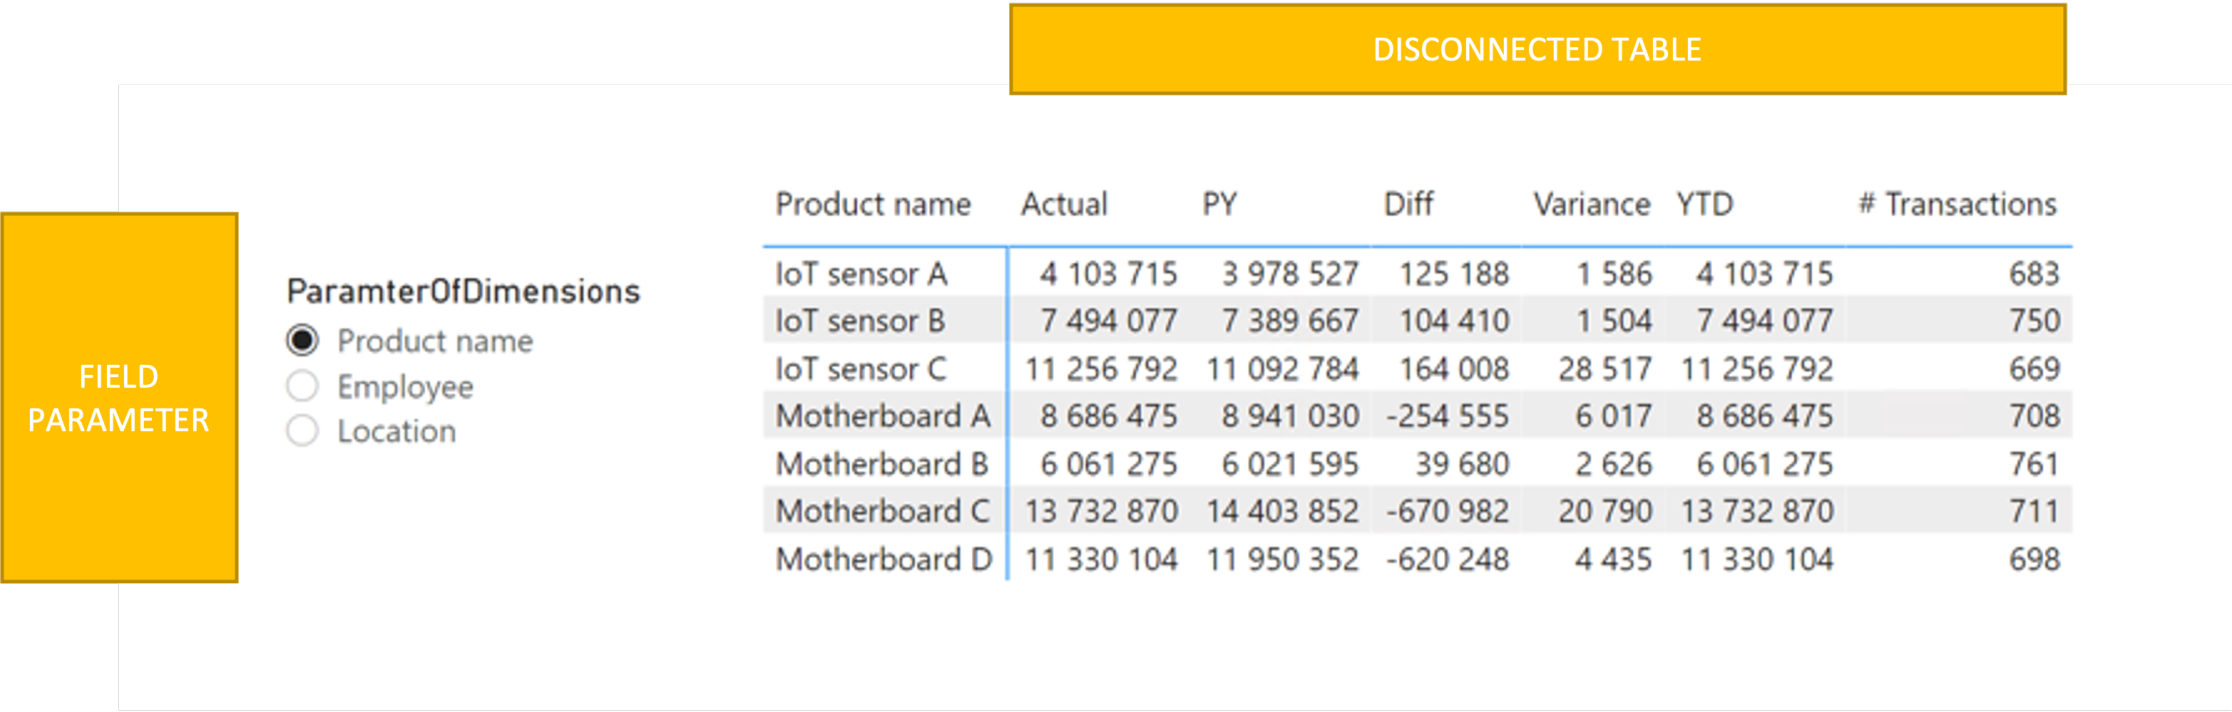
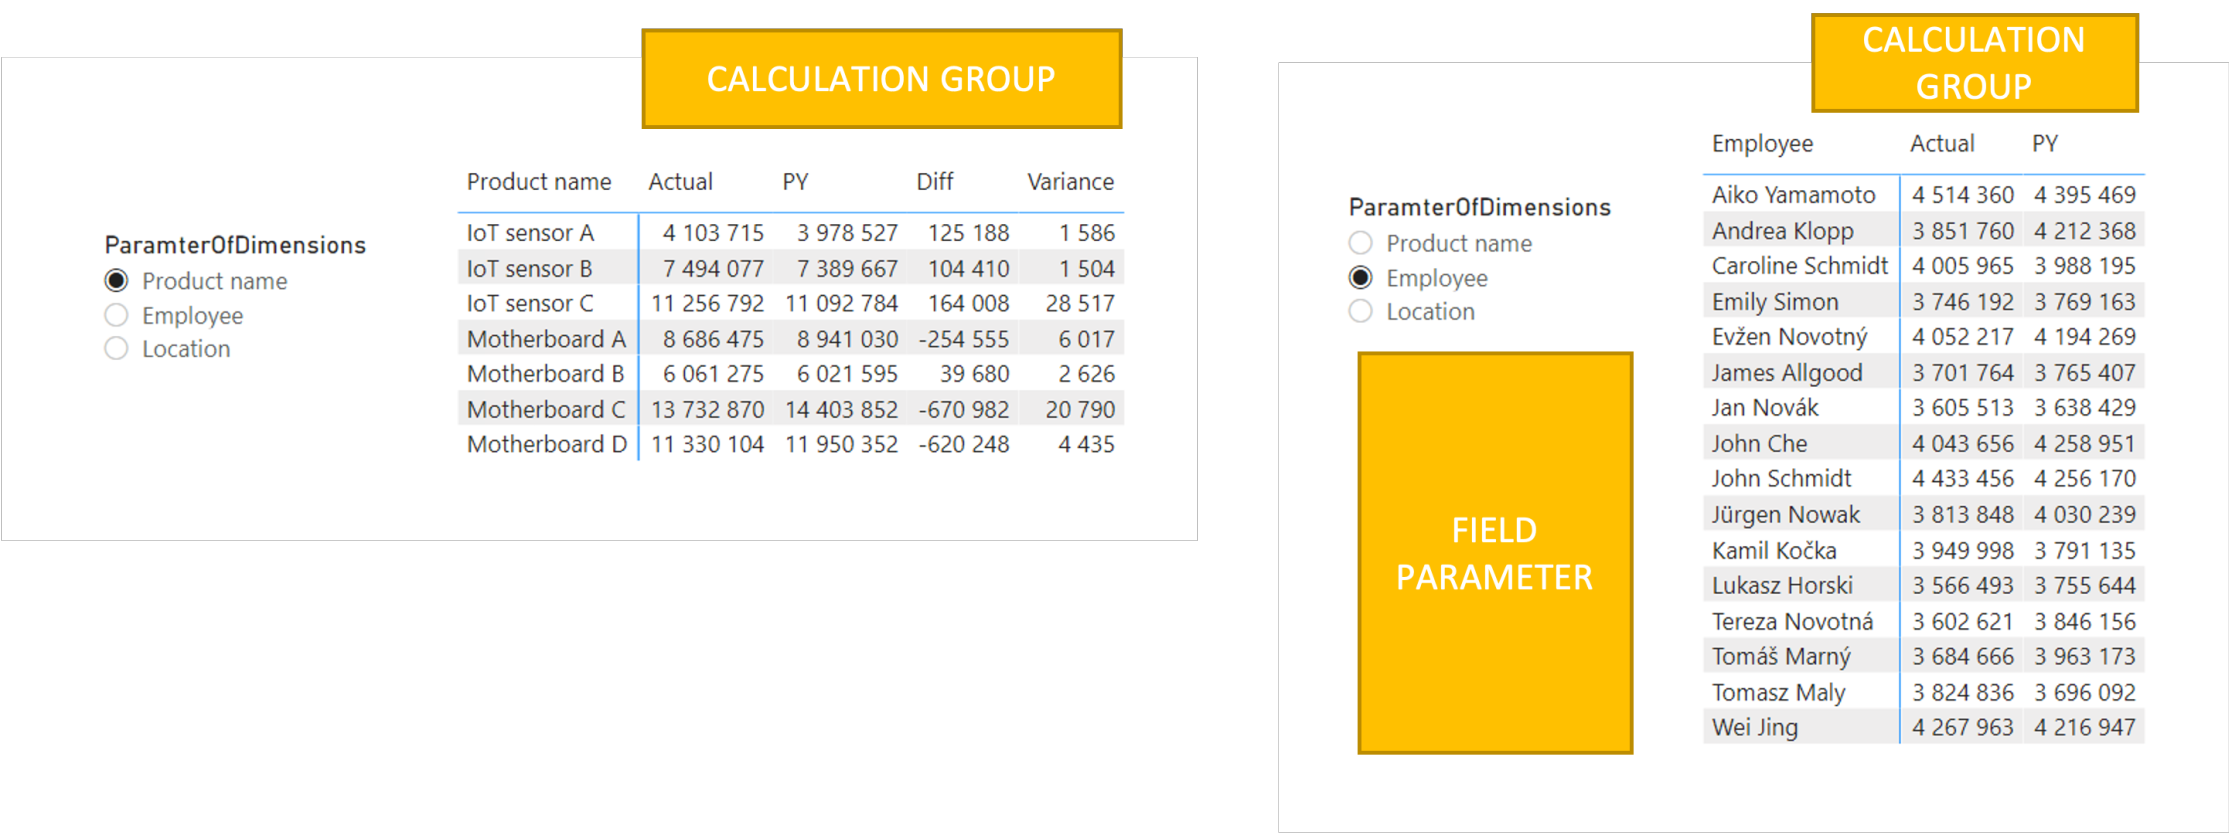
In May 2022 Desktop update, we recieved the Field parameters function into Power BI. This function lets us change dimensions in visuals with a simple click on the slicer. It makes Power BI even more clicky, clicky, draggy, and droppy (How once Christian Wade said).
My initial thoughts
It caught my attention very heavily because I needed this capability years ago. But since then, we recieved calculation groups, which can be used for a similar purpose when we speak about columns in a matrix that are measure driven. And by them, we can set which column will be shown or if we should have some column overridden by the calculation item. But from its nature, calculation groups aren’t switching dimensions, so they can’t change from dimension Products where there are about fifty types and dimension Employees with 12 emails without setting every possible Product and Employee as a different Calculation Item with their own DAX procedure. And to be honest, this would be a waste of time for the developer to be preparing this. Even preparing it by C# script in Tabular Editor would be, from my perspective, a waste of time that could be used for more valuable things. So because of that, I am more than happy that we finally have an easy component that can fulfill this purpose.
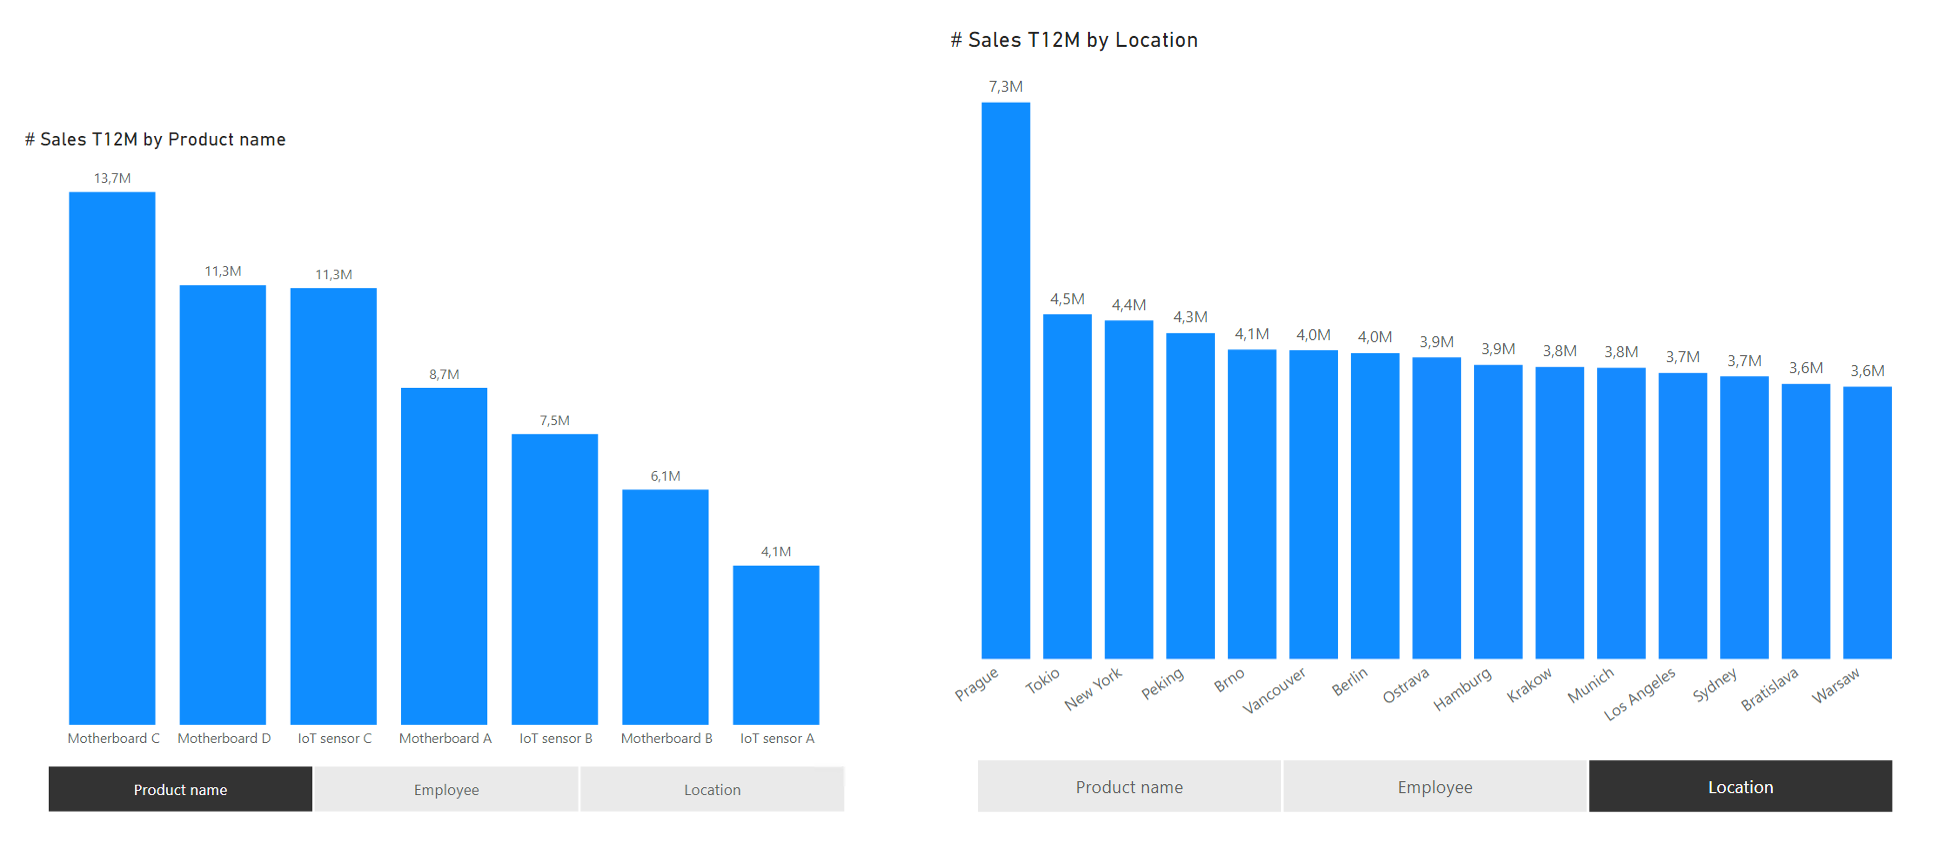 Field parameters in chart
But if field parameters can switch dimensions (let’s call it a Field of Dimensions), can they be switching something else, like measures? Because if yes, then it means that they can overlap calculation groups capabilities.
{
( "Sales", NAMEOF ( ' Measures'[# Total Sales] ), 0 ),
( "Profit", NAMEOF ( ' Measures'[# Total Profit] ), 1 ),
( "Cost", NAMEOF ( ' Measures'[# Total Cost] ), 2 ),
( "Quantity", NAMEOF ( ' Measures'[# Total Quantity] ), 3 ),
( "Margin", NAMEOF ( ' Measures'[% Margin Profit] ), 4 )
}
After a quick test, field parameter parameters can be created from measures. From an abstraction perspective, I am setting like this Field of Measures where I can select which measure will be sent to calculation and which not.
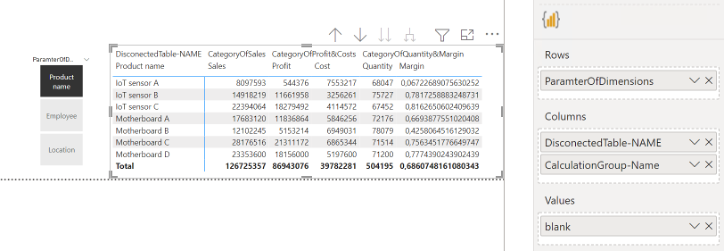
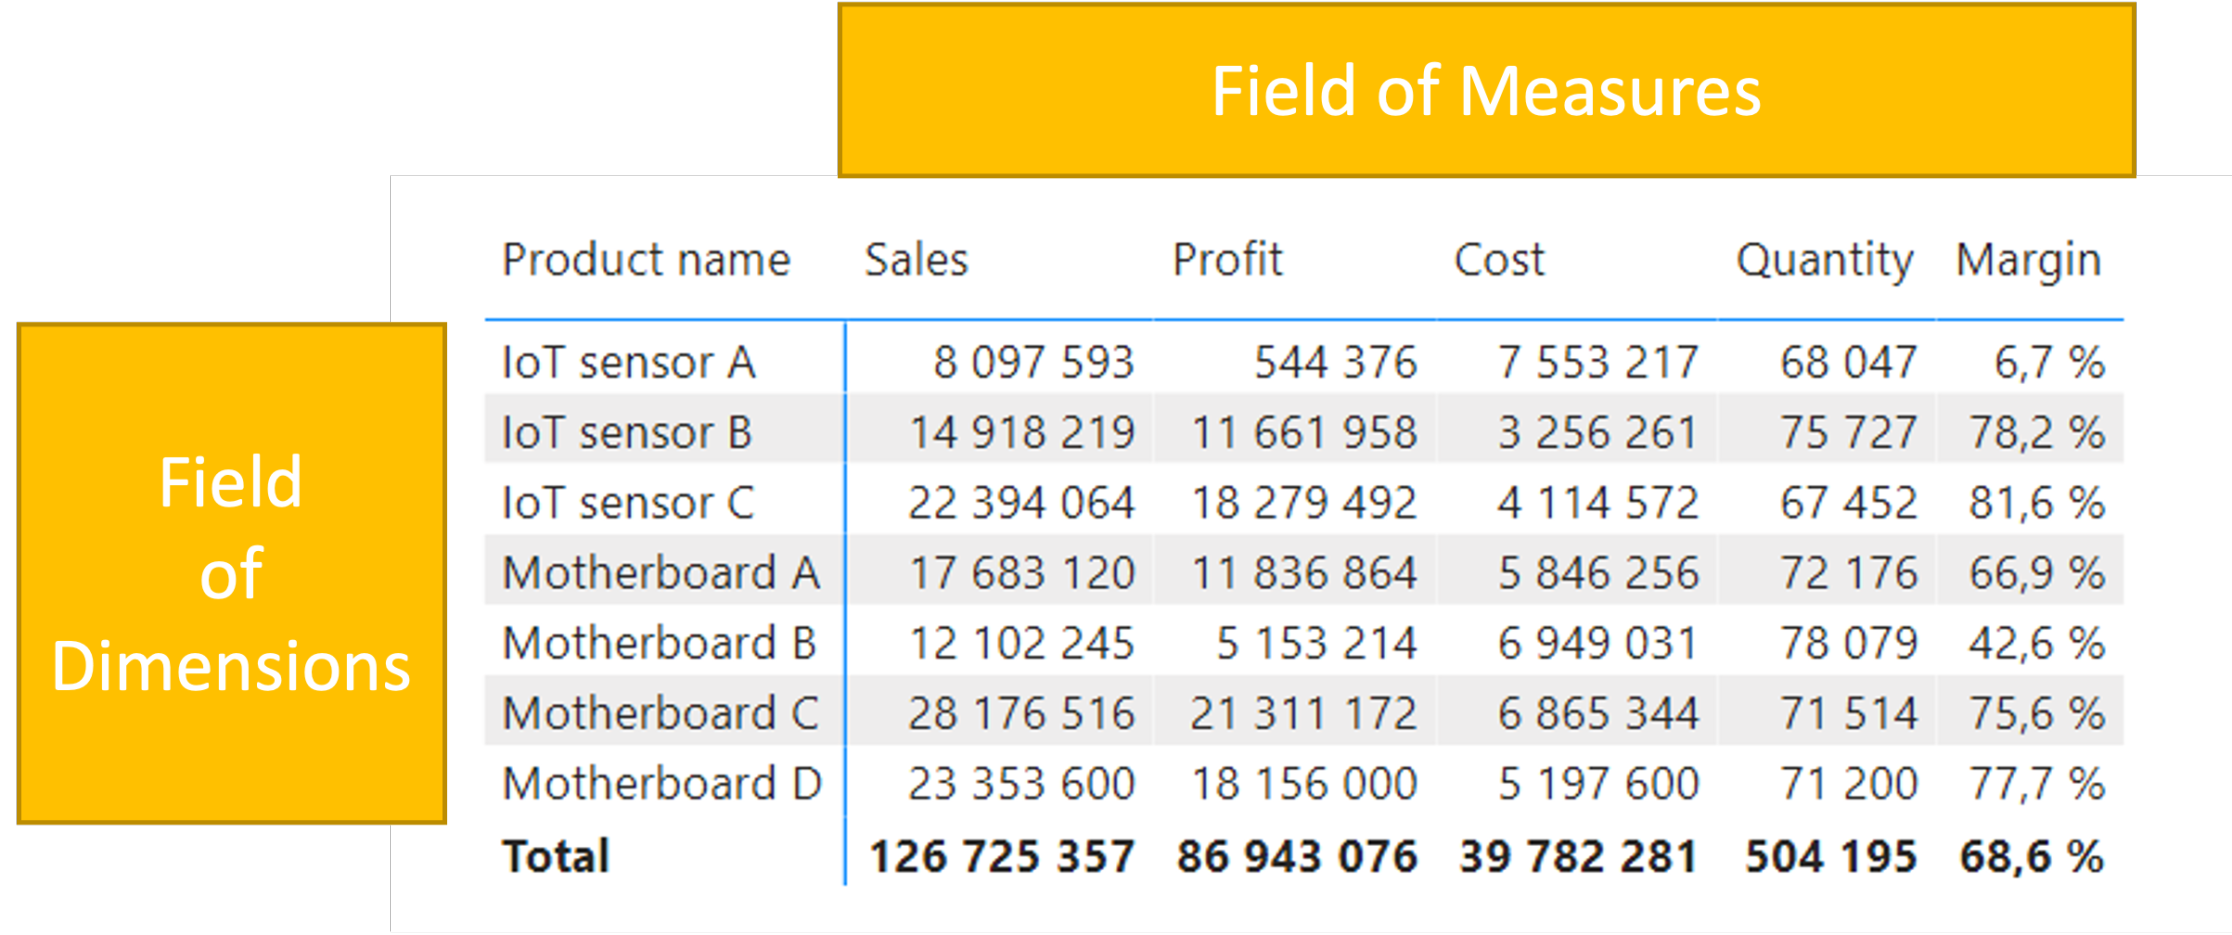 Matrix created by Field of Dimensions and Field of Measures
This matrix is a result of two field parameters:
- Rows: Field of Dimensions
- Values: Field of Measures
And W-O-W! This can make things a lot easier. But It would be great if we could group these items inside.
How to create groups for dimensions/measures in field parameters?
In natively generated code of Field parameters, you can find out that you can add as many of your values (of any type) as you want after ordering.
{
( "Product name", NAMEOF ( 'Pricelist'[Product name] ), 0, "category1" ),
( "Employee", NAMEOF ( 'Employees'[Employee] ), 1, "category1" ),
( "Location", NAMEOF ( 'Location'[Location] ), 2, "category2" )
}
The resulted column can be used as a grouping one. This is the static way how to set up groups. For a dynamic way, we can use the ADDCOLUMNS() function:
ADDCOLUMNS (
{
( "Product name", NAMEOF ( 'Pricelist'[Product name] ), 0 ),
( "Employee", NAMEOF ( 'Employees'[Employee] ), 1 ),
( "Location", NAMEOF ( 'Location'[Location] ), 2 )
},
"DynamicGrouping", IF ( [Value3] < 2, 1, 2 )
)
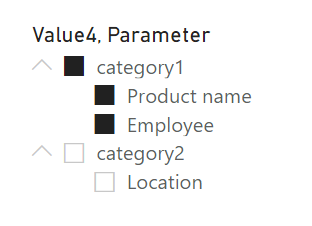 Example of field parameters groups in slicer
With groups, I have finally found where the limits are and when you need to go for Calculation groups.
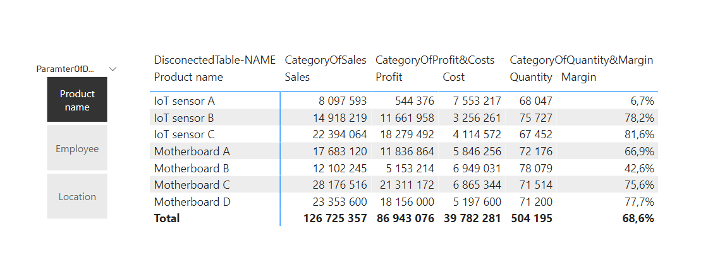
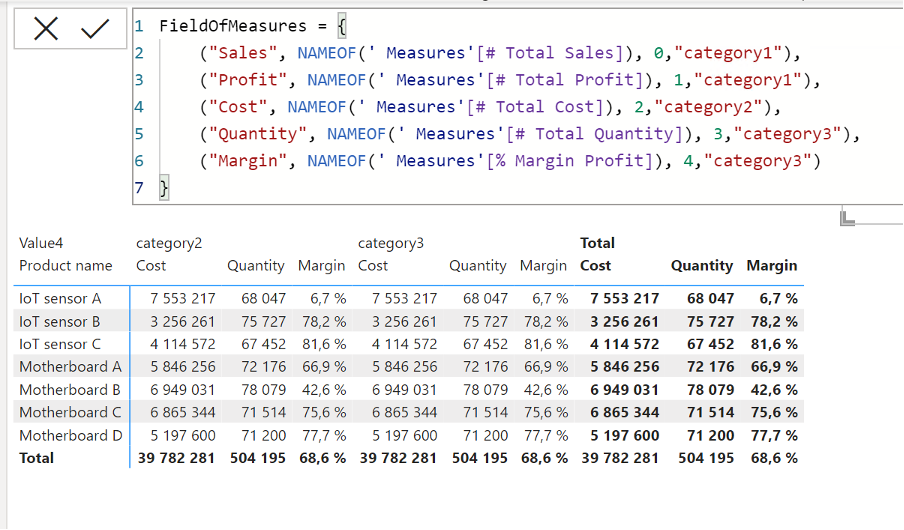 Example of behaviour of field parameters groups in matrix visual
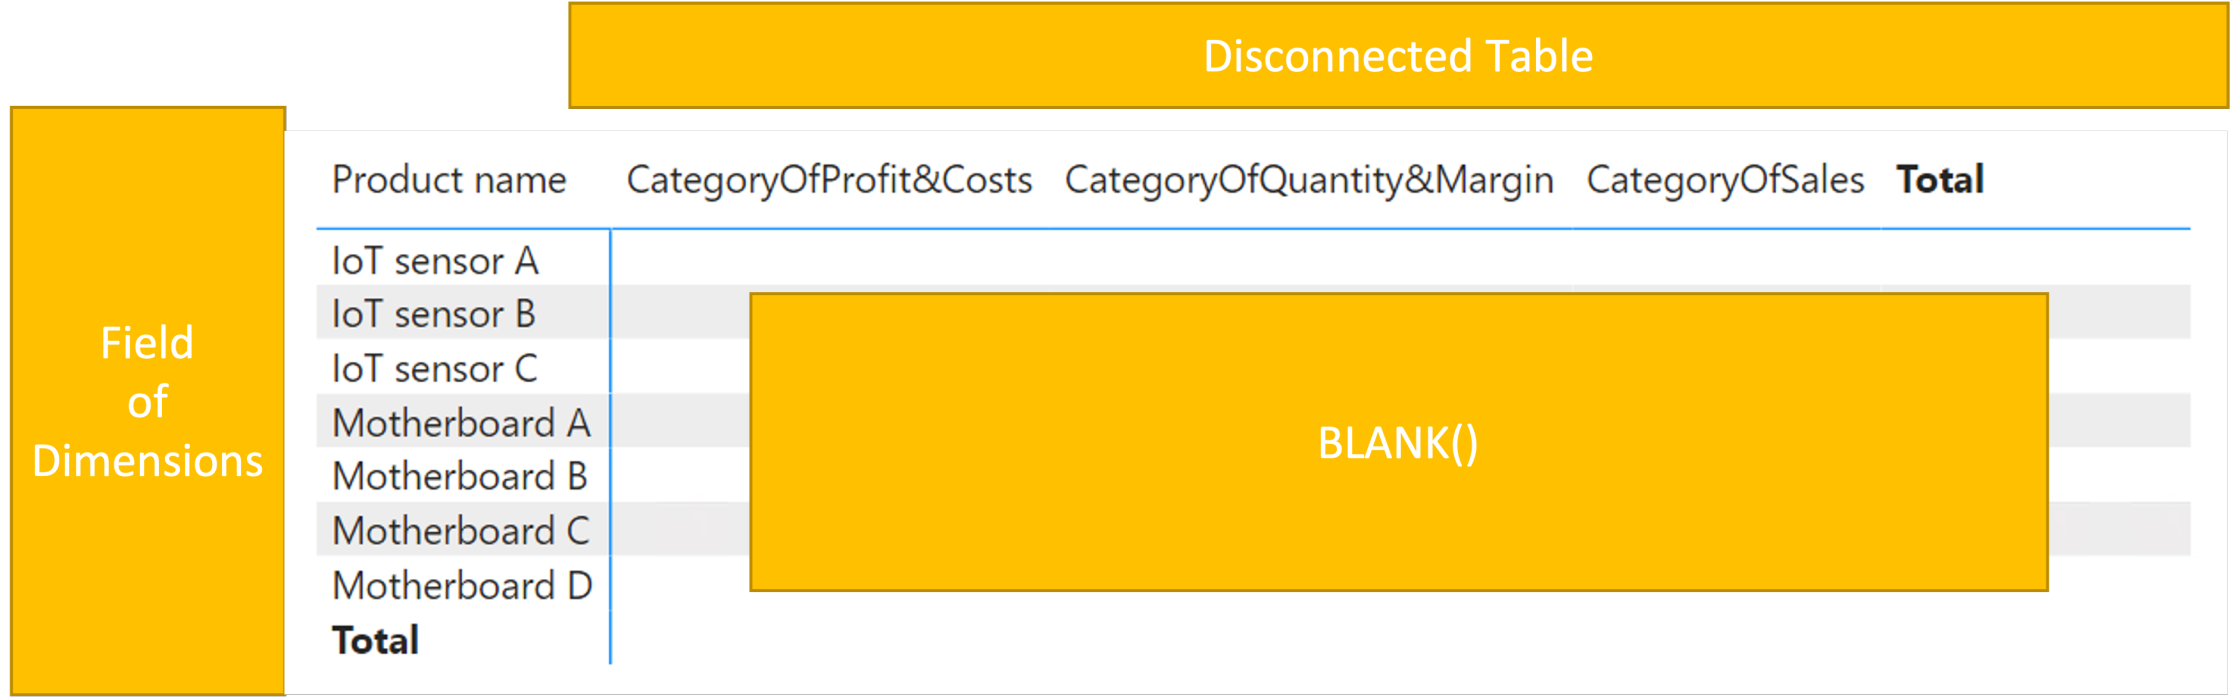
This matrix is the result of shown Field of Measures and Dimension of the Product name. As you can see, Field of Measures doesn’t respect that I want to show the measure name “Cost” only under “category2,” and it shows it under “category3” also. Same it is for measures under “category3” ##even when everything seems to be working in the previously demonstrated slicer visual. This capability of showing just the proper measures under the correct categories in measures is something that calculation groups can do!
How do you show exact measures under selected categories by calculation groups?
There are more methods, but I will demonstrate this topic on method with a disconnected table.
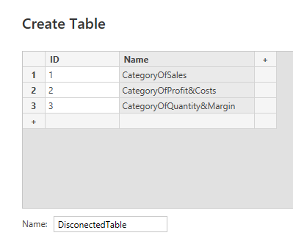 Custom table creation
This table will work completely fine for my purpose. But I have set the ID column to Whole numbers for more capabilities. To clarify. The point of a disconnected table is not to let this table be connected by relationship to any other table.
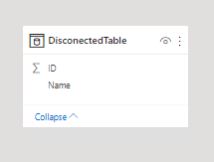 *Disconnected table
I can create a matrix with columns as categories and Fields of Dimensions as rows with this table.
 Matrix created by mix of Calculation group and Field parameter
So field for calculation groups is ready. Now is time to prepare that group and its items that will be the same as I had before inside FieldOfMeasures.
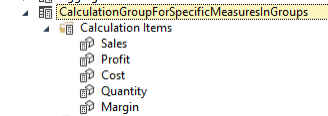 Calculation group in Tabular Editor 3
Suppose I would go into Sales item drop [# Total Sales] alone without any other further DAX expression If would be shown in every category as previously. Bernat Agulló, in one of his articles ( Building arbitrary tables with 2-level column headers ), describes his path in dealing with this distribution of items in groups. In short, besides the disconnected table, I will need any [Dynamic Measure] that the calculation group will override. Because of override, [Dynamic Measure] needs to have some output that can Power BI on most occasions, ignore and doesn’t show it. Like BLANK(). My [Dynamic Measure] has quite a different name [blank]. In the prepared calculation group, I need to edit its items to show the correct output at the right time. That’s precisely what is this code:
IF (
ISSELECTEDMEASURE ( [blank] ),
VAR _selectedCategory =
SELECTEDVALUE ( DisconectedTable[ID] )
RETURN
IF ( _selectedCategory = 1, [# Total Sales] ),
SELECTEDMEASURE ()
)
If I am calling this calculation group against a measure called [blank] positive branch will try to evaluate if the right category is now in scope and return the right measure in an optimistic scenario. If I set this up for every item, I can see that my matrix is finally showing these measures under their categories.
 Resulted Matrix of dynamic groups by Calculationg groups in columns and field parameter in rows
Once I modify the calculated items format strings, my matrix will start to look like I would expect.
 Matrix after changed format string
After switching from parameter “Product name” to “Location,” everything seems to be working correctly.
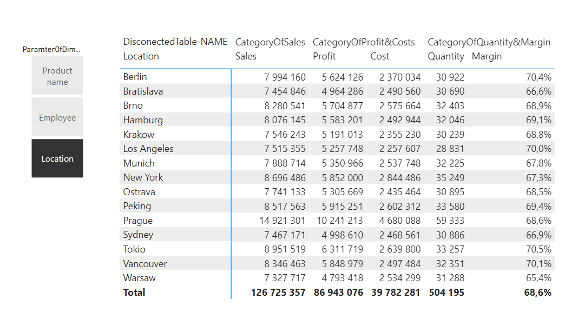 Resulted matrix after switching parameter
This test answers me that calculation groups can work with field parameters very nicely, even in this scenario. But! There is one more point that I want to know!
Can I combine it all to show specific measures for a selected parameter?
So use the field parameter as a category that also decides what measure should be shown. Because in that case, field parameters and calculation groups could make Power BI report pages more dynamic and exciting. Because of the SELECTEDVALUE() function in items, I was a bit worried about how this function will work with field parameters. My fears were justified because the output is with the targeted table, and the column’s name is in square brackets if I would [Parameter2 Fields]. But at least it returns something. Same call but against [ParamterOfDimensions], so against parameter is self returns an Error.
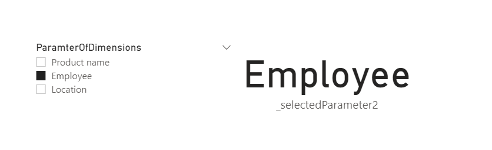
 Content of field parameter
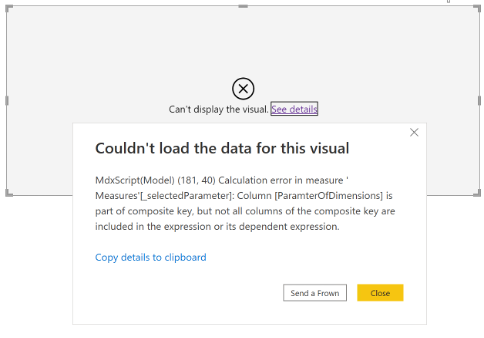 Error returned after calling SELECTEDVALUE funcion directly against field parameter
So usage of SELECTEDVALUE() could be done against the [Parameter2 Fields] column (This is one of the offered columns, which is automatically created in the field parameter), but I would need to parse out the name of a column. I was about to make a solution with this parsing, but I went across this article from Marco Russo - SQLBI Using SELECTEDVALUE with Fields Parameters in Power BI. And reading this article, I am decided that I am not about to use SELECTEDVALUE() for this case. So let’s try Marco’s way.
VAR _selection =
SELECTCOLUMNS (
SUMMARIZE (
FieldParameterOfDimensions,
FieldParameterOfDimensions[ParamterOfDimensions],
FieldParameterOfDimensions[Parameter2 Fields]
),
FieldParameterOfDimensions[ParamterOfDimensions]
)
RETURN
IF ( COUNTROWS ( _selection ), _selection )
Even though Power BI DAX Intellisence does not like that second parameter of SELECTCOLUMNS(), it is still working.
 Output of Marco’s selection measure
I have prepared one more disconnected table for this purpose.
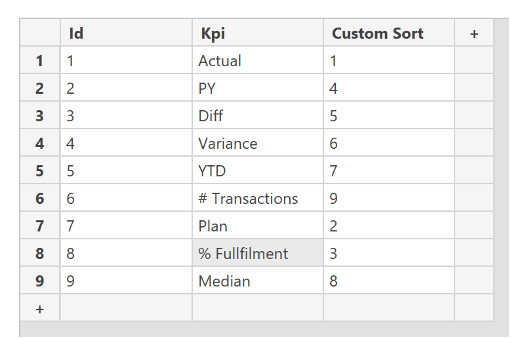 Disconnected table for the second demo with calculation groups
This “Kpi “column contains KPIs I would like to show for my dimensions. But not all KPIs will be shown for every dimension. I want them to show by this list: Product name
- Actual
- PY
- Diff
- Variance
- YTD
- # Transactions
Employee
- Actual
- PY
- YTD
- Transactions
- Plan
- % Fulfillment
Location
- Actual
- PY
- Diff
- Variance
- YTD
- Median
By the same pattern as previously with groups, I prepared one calculation item that should be overriding [blank] measure and showing measures that should be visible only for the selected parameter.
VAR _selParameter = [_selectedParameter2]
VAR _selCol =
SELECTEDVALUE ( 'KPI Column'[Id] )
VAR _result =
IF (
ISSELECTEDMEASURE ( [blank] ),
SWITCH (
TRUE (),
_selCol = 1, [# Total Sales],
_selCol = 2, [PY to date],
_selCol = 3,
SWITCH (
TRUE (),
_selParameter IN { "Product Name", "Location" }, [Diff],
_selParameter = "Employee", BLANK ()
),
_selCol = 4,
SWITCH (
TRUE (),
_selParameter IN { "Product Name", "Location" }, [Variance],
_selParameter = "Employee", BLANK ()
),
_selCol = 5, [# Total Sales YTD],
_selCol = 6,
SWITCH (
TRUE (),
_selParameter IN { "Product Name", "Employee" }, [No of Transactions],
_selParameter = "Location", BLANK ()
),
_selCol = 7,
SWITCH (
TRUE (),
_selParameter IN { "Product Name", "Location" }, BLANK (),
_selParameter = "Employee", [Plan]
),
_selCol = 8,
SWITCH (
TRUE (),
_selParameter IN { "Product Name", "Location" }, BLANK (),
_selParameter = "Employee", [% Plan]
),
_selCol = 9,
SWITCH (
TRUE (),
_selParameter IN { "Product Name", "Employee" }, BLANK (),
_selParameter = "Location", [Med]
)
),
SELECTEDMEASURE ()
)
RETURN
_result
The result was on a first look working, even after switching parameter outputted measure columns were right.
 Switching between fields - Product Name
 Switching between fields - Location
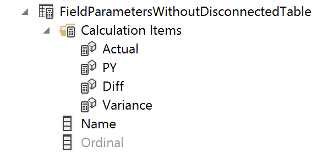
Because It was working with a disconnected table and single items group, it should be working with a calculation group where columns would be directly defined as items without that disconnected table. This consideration led me to the final test. For this test, I have taken just the first four KPIs (“Actual, “PY, “Diff, “Variance”) where all fours should be seen for parameters “Product name” and “Location,” but parameter “Employee” should propagate only “Actual” and “PY” KPIs.
 Calculation group with items created from source measures
Ordinal calculation group with its items that I have mentioned previously. For “Actual” and “PY,” I used this type of code:
VAR _result =
IF ( ISSELECTEDMEASURE ( [blank] ), [# Total Sales], SELECTEDMEASURE () )
RETURN
_result
And for “Diff” and “Variance,” this one should be able to handle when to show these measures samely as it was with a disconnected table:
VAR _selParameter = [_selectedParameter2]
VAR _result =
IF (
ISSELECTEDMEASURE ( [blank] )
&& _selParameter IN { "Product Name", "Location" },
[Diff],
SELECTEDMEASURE ()
)
RETURN
_result
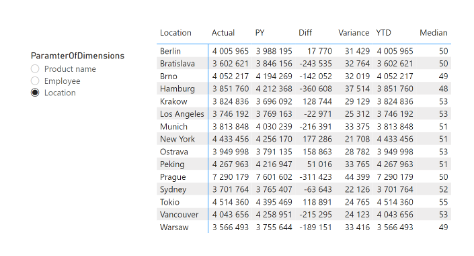
Result? It is working!! So this behavior can be provided with just one field parameter and calculation group.
 Matrixes created by calculcation groups and field parameters that returns dynamic columns based on parameter without disconnected table
From my perspective, this brings new possibilities that can be used to prepare complex report solutions. One page, one slicer, one experience for a user. No necessaries to switch pages. Of course, this can’t be used every time and will have its use cases when you would like to do it this way, but it is excellent to know there is this possibility.
By the end of this article, I would like to thank you for reading it. Do you want to know more about Field parameters and how they work under the hood? Then I would recommend this wonderful article: How Power BI Field Parameters works under the hoods - FourMoo


