


In a previous article about Field parameters, I spoke about using them in cooperation with Calculation groups (LINK). I used them to get specific measures for selected dimensions from the dimensions field. After this test, I have come up with one more challenge for field parameters that we need to deal with from time to time. What challenge? Hierarchies with dynamic levels.
But what are hierarchies, and how to deal with Parent-Child hierarchies in Power BI? I want to recommend you to read about it here in an article from Nikola Ilic: Finding the right PATH - Understanding parent-child hierarchies in Power BI! - Data Mozart (data-mozart.com)
Description of the Issue
Hierarchy in the same table
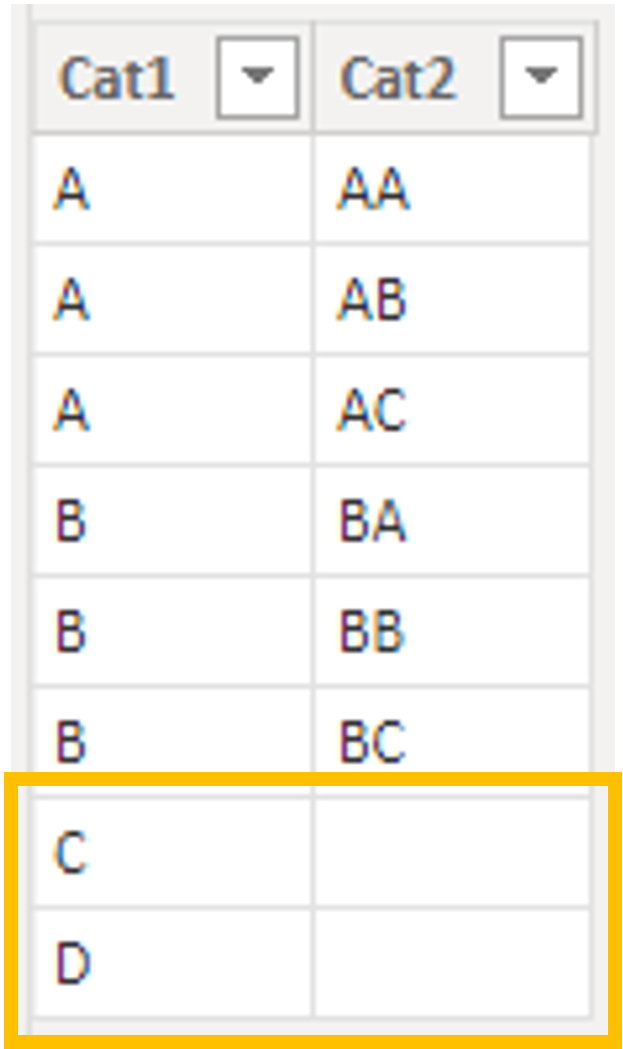
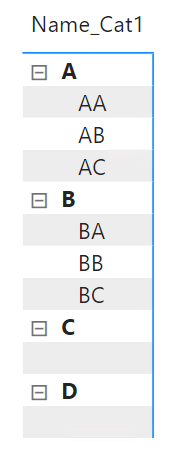
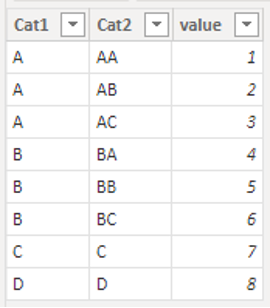
Let me describe the issue. I have two columns, where the first is called „Cat1“ and the second is „Cat2“. Cat1 is a column with the parental name of the child in column Cat2. From time to time happens that Cat1 doesn’t have any children. Like in this picture:
 Hierarchy table
This dimension can be obtained from the original data source, created in Power Query, or PATH functions can create it. These PATH functions are widespread when we are dealing with Parent-Child dimensions.
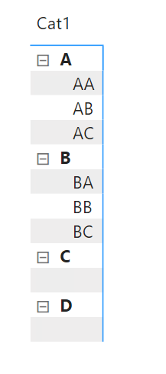
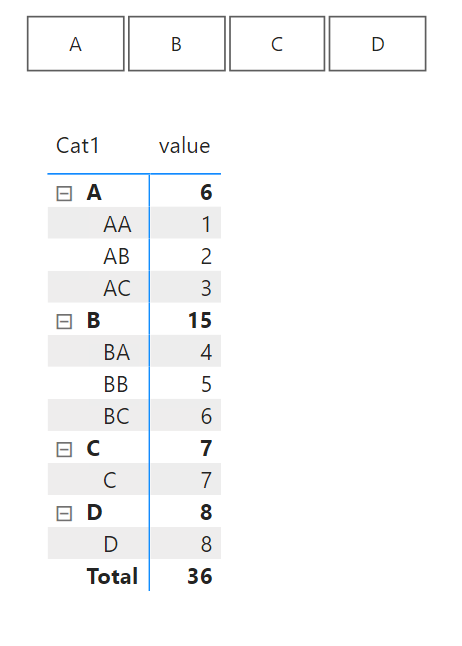
In our case, the dimension will look as follows in the matrix:
 Hierarchy in matrix
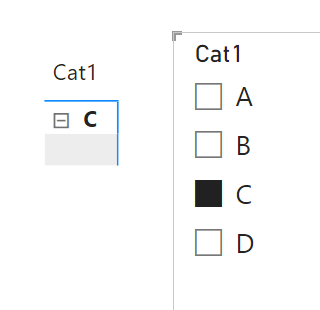
First, I see that the categories „C“ and „D“ have blank in their sub-fields. It is quite understandable because, in our starting table, we have „Cat2“ cells for these categories. Blank cells, but still, they are there. Even when we slice the value „C“ in column „Cat1,“ you will be able to see ”+/-“ buttons with a blank sub-field.
 Filtered matrix
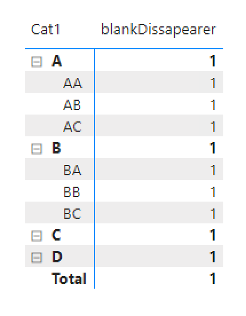
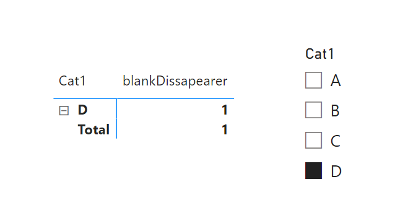
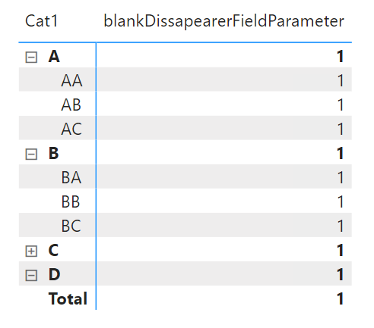
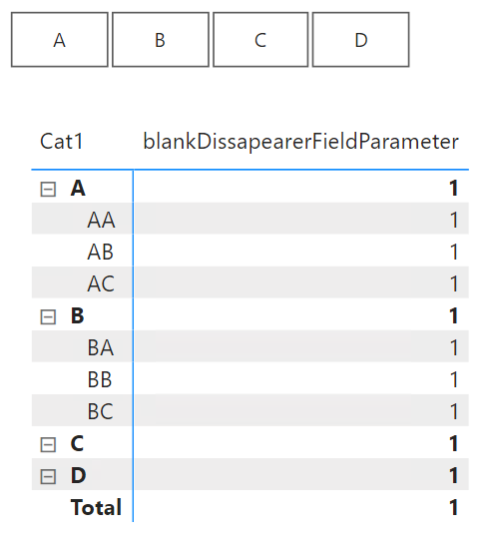
Some tricks make this „blank“ space in the sub-field disappear. One of them can be a measure similar to this one:
|
blankDissapearer =
VAR _selector = SELECTEDVALUE ( hierarchyTable[Cat2] ) RETURN IF ( ISINSCOPE ( hierarchyTable[Cat2] ), IF ( ISBLANK ( _selector ) |
On a place of „1“, you can put your other measure or expression. But the result of this measure will still leave the “+/-“ button next to the parent field.
 Matrix with data
And even slicing on one of these childless parents will not help.
 Filtered Matrix to category with data
It is better than nothing but let’s try something else.
Hierarchy built by relationship
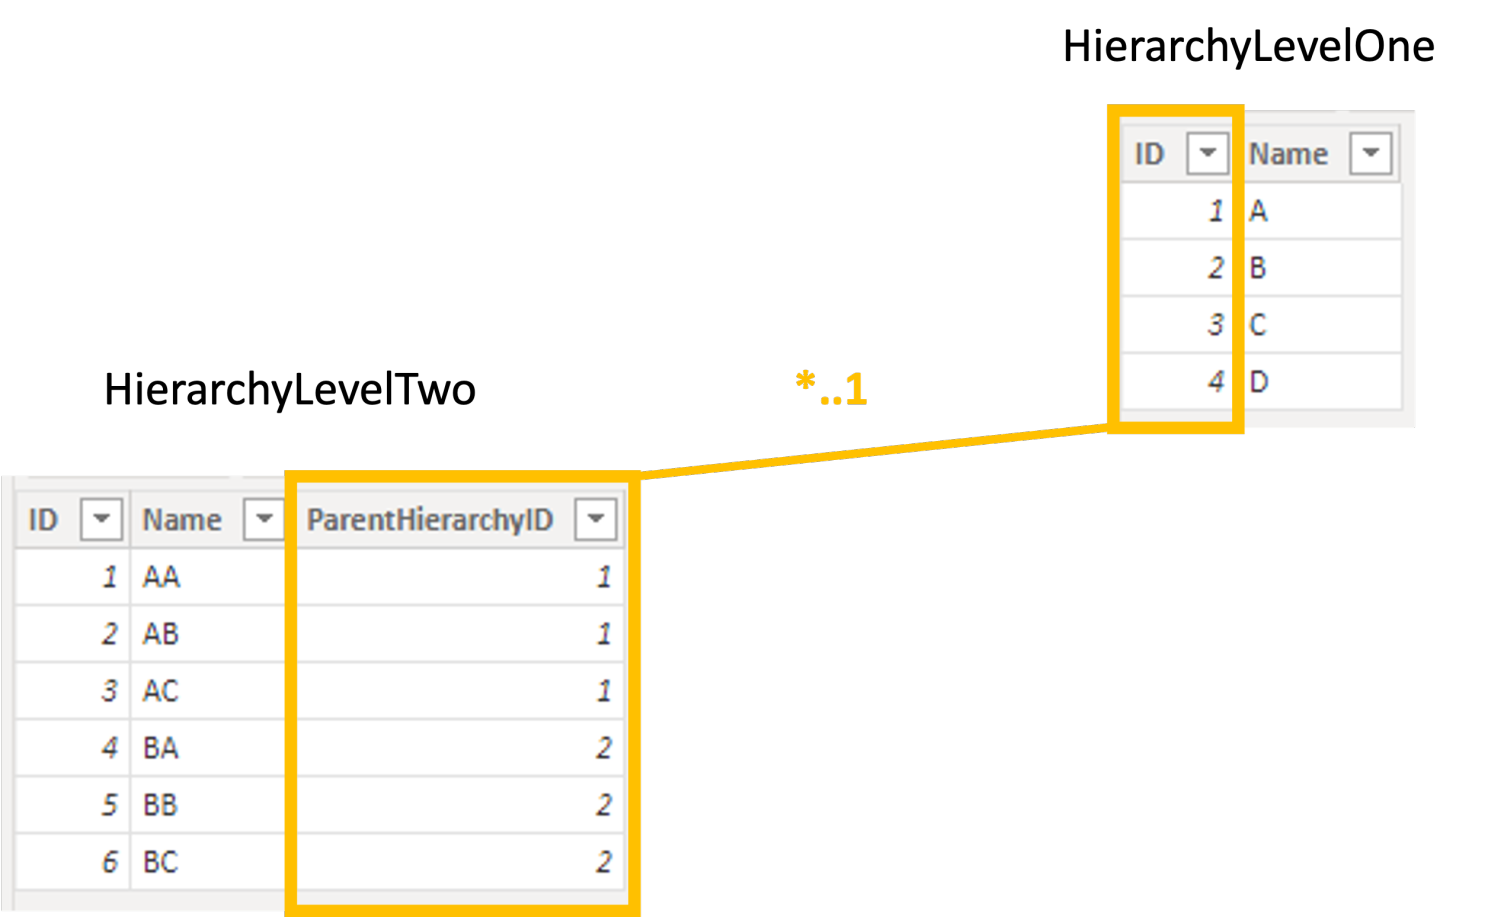
For this example, I have two different tables, „HierarchyLevelOne“ and „HierarchyLevelTwo. “ These two tables simulate similar behavior to what we had in the last part of the article, but now they are connected by relationship.
 Relationship between tables
As you can see, there are no values for „C“ and „D“ from HierarchyLevelOne in HierarchyLevelTwo. The matrix created from this relationship looks the same at first glance.
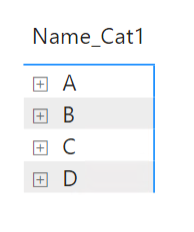 Closed hierarchy
But after expanding, you will lose „C“ and „D“ from the whole matrix. Like they had never been there.
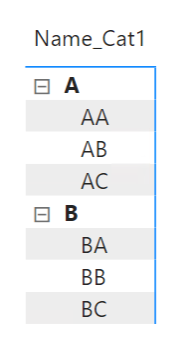 Scoped matrix
Once again, it makes excellent sense because there is nowhere to expand since it has no children. Even with the feature „show items with no data,“ upon a visual, you will get the same result we had before.
 Show categories with no data
Ok… Let‘s turn off the categories again and force „C“ and „D“ to appear by a measure.
IF (
ISINSCOPE ( HierarchyLevelTwo[Name] ),
SELECTEDVALUE ( HierarchyLevelTwo[ID] ),
1
)
Matrix with Our prepared measure in a „Values“ seems much better.
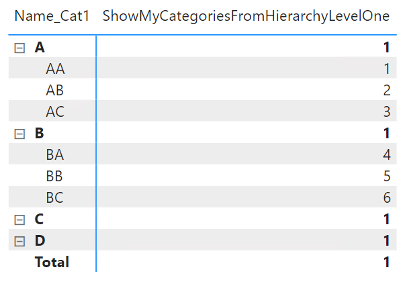 Node Level by ISINSCOPE
But once again, the ”+/-“ buttons still appear. Even the behavior with slicing on just one childless category is the same.
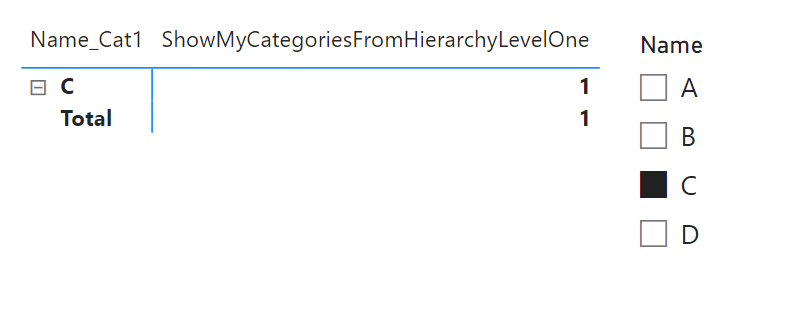 Filtered matrix on single category
That’s not what I am looking for. I am looking for any solution that would also allow me to make the ”+/-“ buttons disappear. But that would mean that I have to be able to return only a selected number of dimensions to the rows and be able to change them dynamically.
Wait… This is what Field Parameter can do!!!
Field Parameters vs. Hierarchies
First things first. If we use field parameters in a slicer with a single selection for values and a matrix, it will switch between dimensions in rows. With multi-select, we can even define if there should be some hierarchy on row level and which dimension will be used as the top-level one (by selecting it in order).
Next, a critical point to keep in mind when trying to do some DAX Tweaks with field parameters is that they are executed BEFORE other values in a model. Gilbert Quevauvilliers has described that in his article: How Power BI Field Parameters works under the hoods - FourMoo.
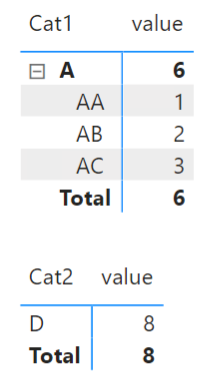
I have created my field parameter from the slightly similar table I used at the beginning of this article. The main difference is that if the value in „Cat1“ doesn’t have any children, then „Cat2“ takes value from the column „Cat1“.
 Parent-Child hierarchy table
Prepared field parameter:
{
( "Cat1", NAMEOF ( 'hierarchyTable'[Cat1] ), 0 ),
( "Cat2", NAMEOF ( 'hierarchyTable'[Cat2] ), 1 )
}
Field parameter in matrix with values:
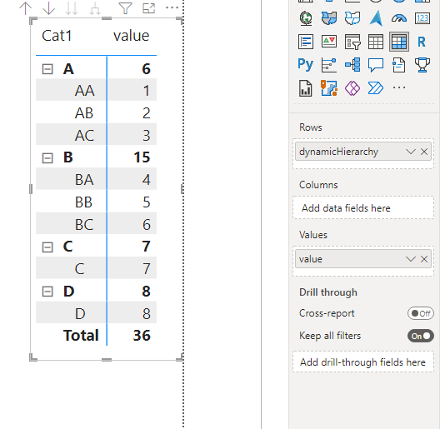 Matrix with Field Parameter
The fantastic thing is that field parameters also carry the filters applied to the source. As a result, I can use the original column „Cat1“ as a slicer and slice visual just on the perspective, which I need.
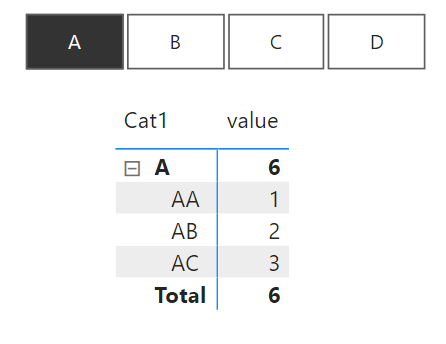 Parameter affecting Matrix
But these filters can be combined with filters directly executed against the field parameter dimensions. Even with parameters that are not initially from Power BI itself. Like with a new column that can be added to these field parameters.
{
( "Cat1", NAMEOF ( 'hierarchyTable'[Cat1] ), 0, "levelOne" ),
( "Cat2", NAMEOF ( 'hierarchyTable'[Cat2] ), 1, "levelTwo" )
}
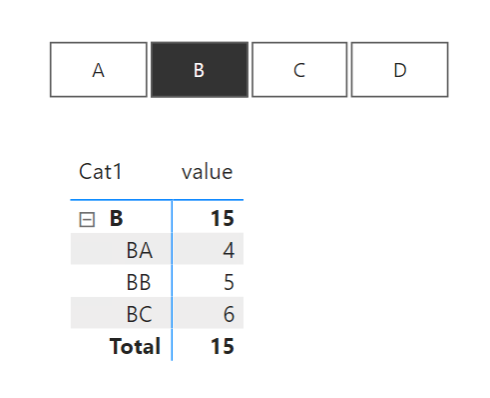
I know I can use „Cat1“ or „Cat2“ in a slicer to determine which of these or if both should be executed, but I can use this new column identically.
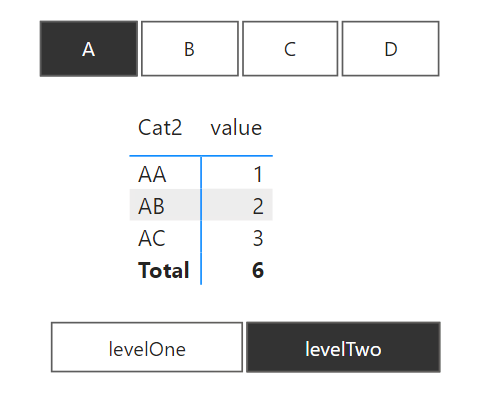 Table filled just by Field Parameters
As you can see. When I have „levelTwo“ selected from the original matrix, I can see the second-level hierarchy.
I want to mention Gilbert’s article once again. Why? Because by talking there about the fact that before the data for the second run of the evaluation is executed, the influences that affect the field parameter as a whole are evaluated. It follows that in the same matrix, where I have two-level hierarchies and one-level hierarchies, I cannot get rid of the ”+/-“ button.
I can achieve the same behavior by minor modification of the code mentioned above. Or to have a ”+/-“ button without an empty child field.
VAR _selectorLevelTwo =
SELECTEDVALUE ( hierarchyTable[Cat2] )
VAR _selectorLevelOne =
SELECTEDVALUE ( hierarchyTable[Cat1] )
RETURN
IF (
ISINSCOPE ( hierarchyTable[Cat2] ),
IF ( _selectorLevelTwo = _selectorLevelOne, BLANK (), 1 ),
1
)
 New measure inside Matrix
It also applies for this scenario that if I choose a category with this measure that does not have a subordinate category, the “+/-“ buttons remain.
 Filtered matrix with dissapearer measure
In doing so, I would prefer to get the results like this:
 Expected result
What if we tried to make Power BI (when evaluating the field parameter) first check whether the given “one” category has a child category and, accordingly, make a selection on us that is similar to what we would do if we chose the value “levelOne” in the slicer or would we leave all elements selected?
If I were to filter the slicer and hide it, it would unfortunately not help me because the same value would always remain in it, even if all were selected. I can display only one value through the filter pane, and still, the rest of them would be promoted into the model. So a slicer is also out of the question, as are bookmarks.
In this case, the solution could be found within the filter pane directly on the visual or Matrix. Dynamic selection can be obtained here using the TOPN filter type, which is the only filter type that natively supports the measures input. However, I have to filter the table with the field parameter directly to get this calculation into the first evaluation cycle.
The TOPN function can be very annoying and helpful in Power BI. If you had a table on which you wanted to use the TOPN function, and the resulting selection values had the same values in the first two categories, then both of these values would be returned, even if the function was set to the TOPN(1) variant (i.e., return first best result only). At the same time, it should be said that TOPN within the filter behaves in such a way that it performs the specified operation for each input row of the column and makes a decision based on its output. We could use precisely this behavior for our scenario!
Solution
For our purposes, I once again slightly modified the field parameter. Specifically, I added a column that for Cat1 = 0 and for Cat2 = 1. In general, the natively hidden column [Ordinal] could be used for this solution, but for more customizable purposes, and it is also possible to use your column.
{
( "Cat1", NAMEOF ( 'hierarchyTable'[Cat1] ), 0, 0 ),
( "Cat2", NAMEOF ( 'hierarchyTable'[Cat2] ), 1, 1 )
}
I remind you that if you make that column like this, it will bear the name “Value”+(serial number) ([Value4] It is in our case.), you could also name it yourself via ADDCOLUMNS().
I then insert the newly created column [Value4] into the filter pane of the matrix and set it to TOPN. I still miss a measure that tells me the “number” of returned columns.
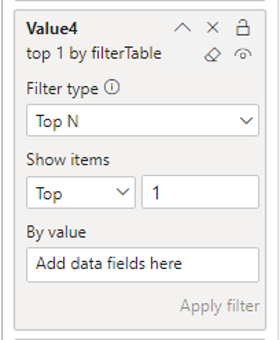 TOPN Filter
So I get the selected first level and compare it with the selected second level from the original table from which the field parameter comes. If the values are the same, then I return the value of the column [Value4] to its original state. Otherwise, I multiply it by zero. Multiplying by zero makes all values equal. They will be zero. Since all the values are the same, TOPN will return them all. In the same way, this measure checks if more than one value is selected for the main category to return all levels eventually.
VAR _selectedCategoryLevelOne =
SELECTEDVALUE ( hierarchyTable[Cat1] )
VAR _selectedCategoryLevelTwo =
SELECTEDVALUE ( hierarchyTable[Cat2] )
VAR _selectedparam =
SELECTEDVALUE ( dynamicHierarchy[Value4] )
RETURN
IF (
( _selectedCategoryLevelOne = _selectedCategoryLevelTwo )
&& NOT ISBLANK ( _selectedCategoryLevelOne ),
_selectedparam,
_selectedparam * 0
)
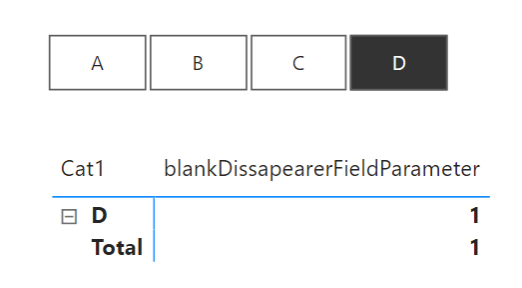
After inserting it into the filter and applying it, the table did not change at first glance. The change occurred only after selecting a value from the slicer:
 First result
 Second result
 Third result
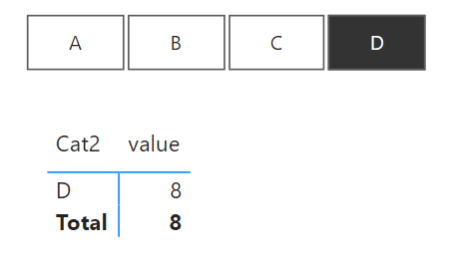
As you can see, now, when selecting the “D” value, the ”+/-“ button is no longer displayed at all, but it is for the “B” value. Of course, it would also be possible to combine it with the previous measures so that even in this case, under the value “D,” we do not show the sub-category “D” in the display of all values.
 Without any selection
Summary
In general, it could be said that we succeeded. We already know that here in Power BI, options allow us to manipulate matrix visuals even for the needs of dynamic hierarchies. But at the same time, we know that there are certain limits we are currently running into. At the same time, I would like to mention that everything in this article is shown in a very general way, but the use depends only on the scenario.