


Among the new DAX functions is the INDEX function. I was skeptical about this. Because in comparison to the other added functions, there is not a dynamic position concerning the position currently being evaluated. It looks at the input table as a stable view, where it can move using the 1…X or -1…X coordinates.
But this feature gave me the idea that it could replace MINX and MAXX in some moments when moving around the Date dimension. After all, “1” is MINX, and “-1” is MAXX. This is quite simple. At the same time, in contrast to the OFFSET function, for example, it does not make shifts that would stack on top of each other with each subsequent OFFSET (see the previous article), so it is much easier to understand.
But without a practical example, it’s just an “interesting” feature. So I set out to explore it a bit and use it in a real scenario… as it happens, it’s a scenario that combines calculation groups at the same time.
Scenario
We have the following model that stores data about the status of business opportunities based on the date, customer, product, state of opportunity, salesman, and goals for the particular year.
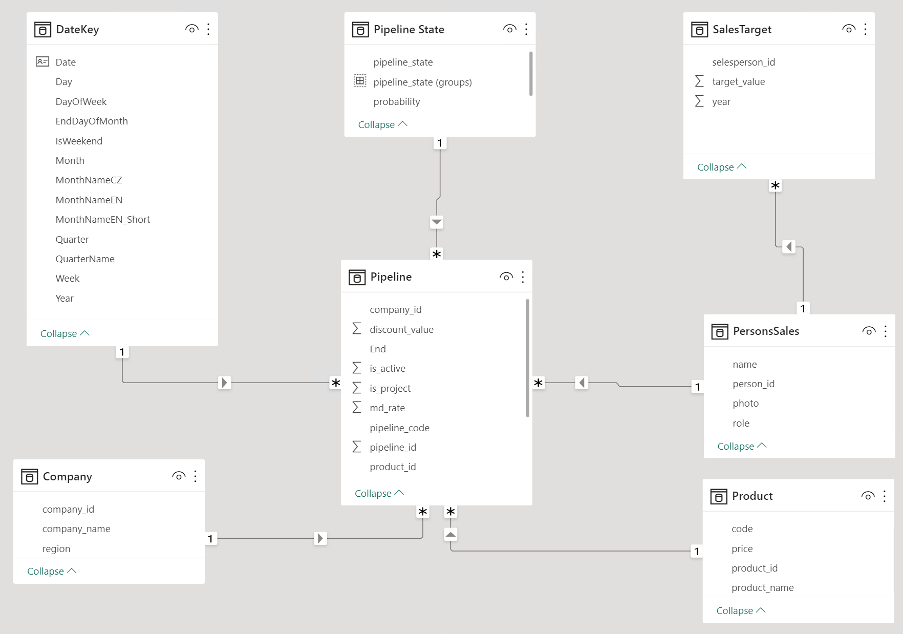 Used model
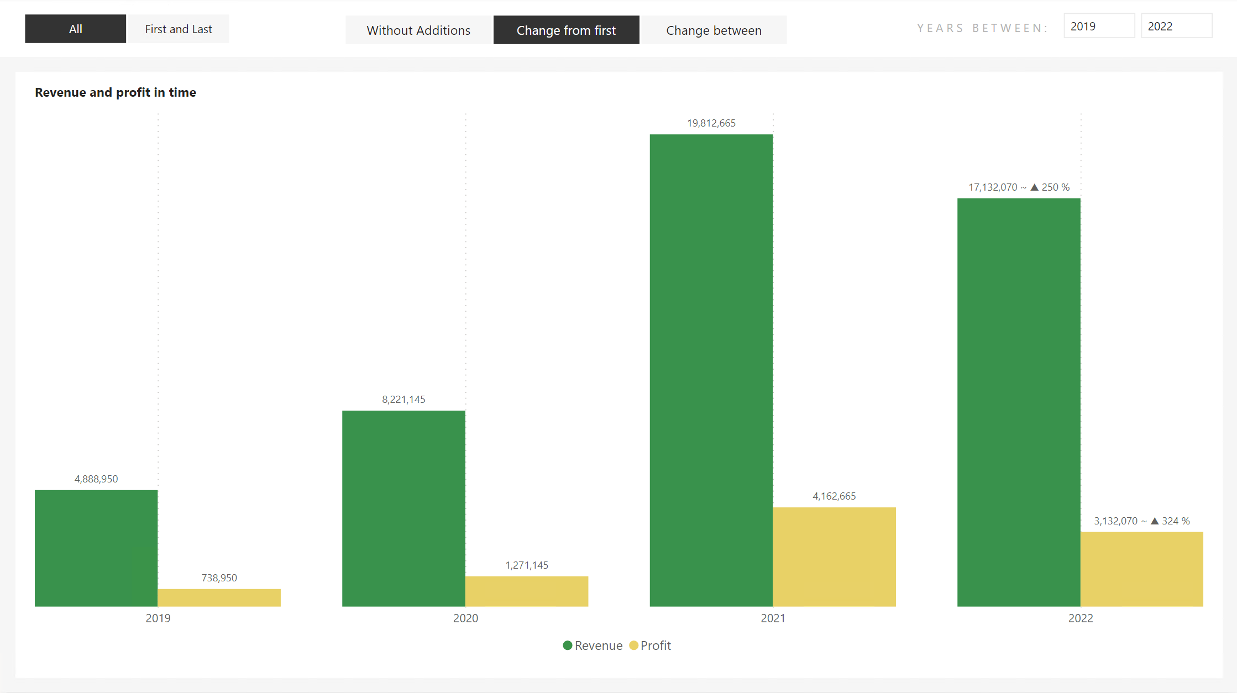
Our assignment is that we want to quickly analyze the year-on-year results of Revenue and Profit on one page of the report with the ability to see interannual changes if we want to. At the same time, we should be able to choose which years this analysis will be performed and, if necessary, be able to compare only the first and last year of the selection.
Let’s start from the very beginning. First, you’ll need to prepare an input chart with all values and then modify the content using Calculation Groups.
I want to display the values in individual years to support the ability to imagine their significance, especially in the relationship between the required Revenue and Profit. For that purpose, the selected chart could represent the timeline. And since the values of individual years do not directly depend on each other because they are closed values, I will choose a clustered column chart.
The DateKey[Year] column will appear on the X-axis, and two measures will appear on the Y-axis, which will calculate the required quantities from the model.
CALCULATE (
[# Sum of Pipeline Potential],
FILTER ( ALL ( 'Pipeline State'[state_id] ), 'Pipeline State'[state_id] = 4 )
)
[# Sum of Revenue from Pipepine] - [# Costs of Won Projects]
The chart looks good. It visually shows the differences between individual years, and data labels explain the values of specific years.
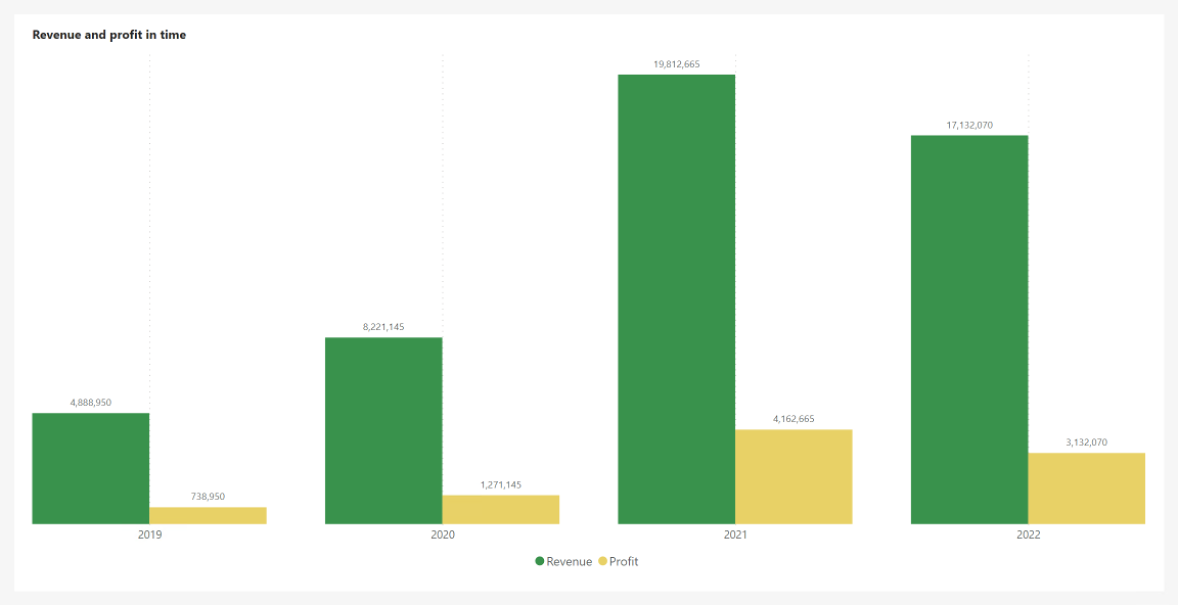 Initial chart
Leave the selection of years to the user within the slicer.
 Used slicer
Let the fun begin! Now you have to fulfill the entry requirements.
The first and last selected year
The requirement was that it should be possible to compare only the first and last selected years. Not just all in the selection. Remember what I said in the beginning? INDEX can move through the specified view using the index:
- 1 = START
- -1 = END
That’s all we need for this request.
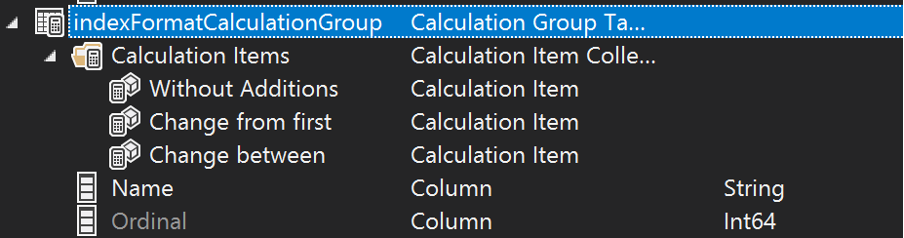
Let’s create a Calculation Group named “indexFormatCalculationGroup”, where we will need two items:
- ALL - Displays all selected years
- First and Last - Displays values only for the first and last year of the selection
Choose their Order as you see fit, but I will set the ordinal for ALL to 0 and for First and Last to 1 so that it is easier to guide the user to the overall view by default.
The item called “ALL” is easy. We just let the calculation flow through it. Let’s leave the Format String Expression empty.
 Expression of first calculation group
First and Last is an item that should interest us. Within it, we will not focus on Format String Expression again. But let’s focus on Expression, where we have to build the calculation so that values are returned only if it is the first or last value in the selection.
Our specified view is just the X-axis, which determines the years for us, and given that we want the calculation to respect all SELECTED years and not just one currently being evaluated or all of them, we have to work with the ALLSELECTED function directed to DateKey[Year] column.
This way, we will return only the selected period. DAX Guide (INDEX – DAX Guide) The DAX Guide says in the INDEX definition that it has four optional parameters. Yes and no. The function requires that the ORDER or RELATION parameter be filled. They can easily be both when RELATION is the specified view for him, and ORDER allows you to define according to which column the input will be sorted. ORDER is defined through another new function called ORDERBY, which default sorts input columns Ascending (can be changed to DESC – see documentation).
But what needs to be said is that INDEX returns a table with one row! With one column, such a result can be treated as just one value.
INDEX ( -1, _insertedTable, ORDERBY ( DateKey[Year] ) )
VAR _first =
INDEX ( 1, _insertedTable, ORDERBY ( DateKey[Year] ) )
So “_last” in this notation will return 2022 and “_first” 2019. So it returns the same results, for example, MAXX(_insertedTable, [Year]) and MINX(_insertedTable, [Year]).
But now, you have to use the results and wrap them up in a simple calculation.
ALLSELECTED ( DateKey[Year] )
VAR _last =
INDEX ( -1, _insertedTable, ORDERBY ( DateKey[Year] ) )
VAR _first =
INDEX ( 1, _insertedTable, ORDERBY ( DateKey[Year] ) )
VAR _actualYear =
SELECTEDVALUE ( DateKey[Year] )
RETURN
IF ( _actualYear IN { _first, _last }, SELECTEDMEASURE (), BLANK () )
Let’s deploy the items created this way to Power BI and look at the results. Let’s start with the “ALL” item. Everything looks the same, so good!
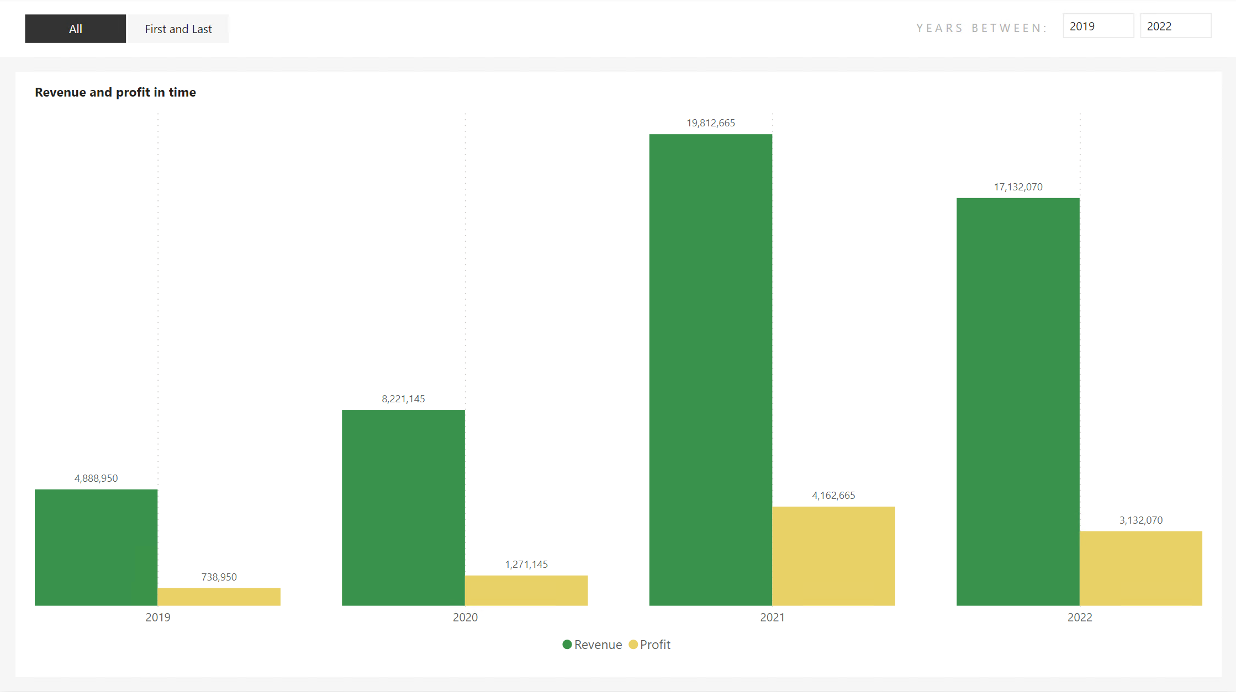 ALL - item selected
So what about First and Last? It works too! Excellent! So we can move on to the following requirement.
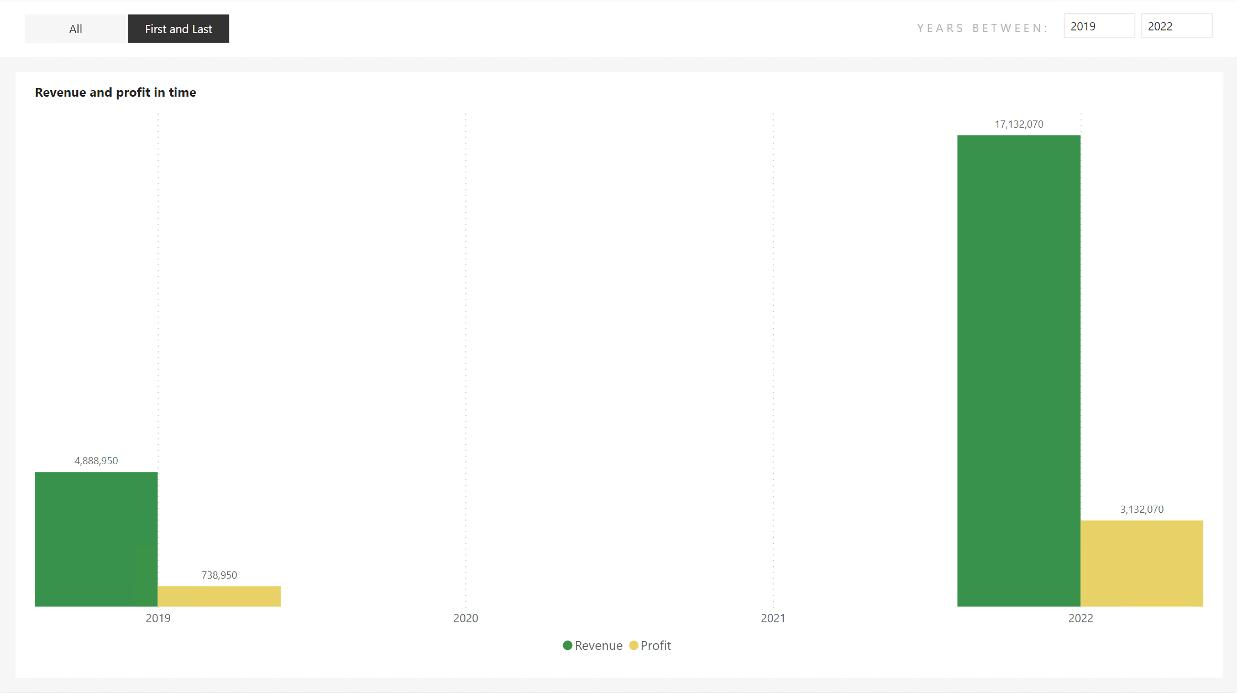 First and Last - item selected
Interannual changes
This is something that could be portrayed in different ways. For example, in a table, another similar chart, cards,… But all it would mean is that we would be distracting from the main chart we have created here. Could we display this additional information directly in the existing graph as part of the Data labels? Then it would be an add-on that will complement the current information. That sounds good to me, so let’s give it a try.
We need to reach for the calculation group again to edit the data labels while keeping the values as values and not converting them to text. It would be good to give the user the option to say whether he wants to see them or not and possibly in what form. This should direct us to use another new group, which will have the evaluation set only after the one we have already created. So, create a new one called “indexFormatCalculationGroup” with precedence 1. Remember to set the previous calculation group precedence to 0.
Settings of indexFormatCalculationGroupd
And let’s make three items in it. One that will not do anything so that it will be the same as in the previous “ALL,” and two that will modify the data labels. Specifically, we could give the user a choice here whether they want the % difference between each ascending year or the % difference between the first and last year of the selection. Item names:
- Without Additions
- Change from first
- Change between
 Created group indexFormatCalculationGroup with items
Like last time in the “Without Additions” item, we will use SELECTEDMEASURE() in the Expression and do not specify anything in the Format String Expression. It is not necessary.
Change from first
Item “Change from First” will be more interesting! Within Expression, the SELECTEDMEASURE() function will also suffice, but what about Selected Measure Format String? We have to do a similar calculation to the first calculation group! Take the result of the first year of selection and compare it with the last. Long live the INDEX! After all… it’ll make it a lot easier for us.
Let’s stop for a moment. Once we get that % difference, it doesn’t end there. The values we have used are numbers in themselves, not small. At the same time, these numbers are the main reason we go into this analysis. We should stick the obtained percentages to the existing values rather than overwrite them. So we need to combine the current Format String with the newly acquired percentages.
ALLSELECTED ( DateKey[Year] )
VAR _lastYear =
INDEX ( -1, _insertedTable, ORDERBY ( DateKey[Year] ) )
VAR _last =
CALCULATE ( SELECTEDMEASURE (), _lastYear )
VAR _first =
CALCULATE (
SELECTEDMEASURE (),
INDEX ( 1, _insertedTable, ORDERBY ( DateKey[Year] ) )
)
VAR _divFormat =
IF (
_lastYear <> SELECTEDVALUE ( DateKey[Year] ),
"",
VAR _div =
DIVIDE ( _last - _first, _first )
VAR _format =
FORMAT ( _div, "# %" )
RETURN
" ~ " & _format
)
RETURN
CONCATENATEX ( { SELECTEDMEASUREFORMATSTRING (), _divFormat }, [Value], " " )
The original Expression from “First and Last” modified this way should theoretically work.
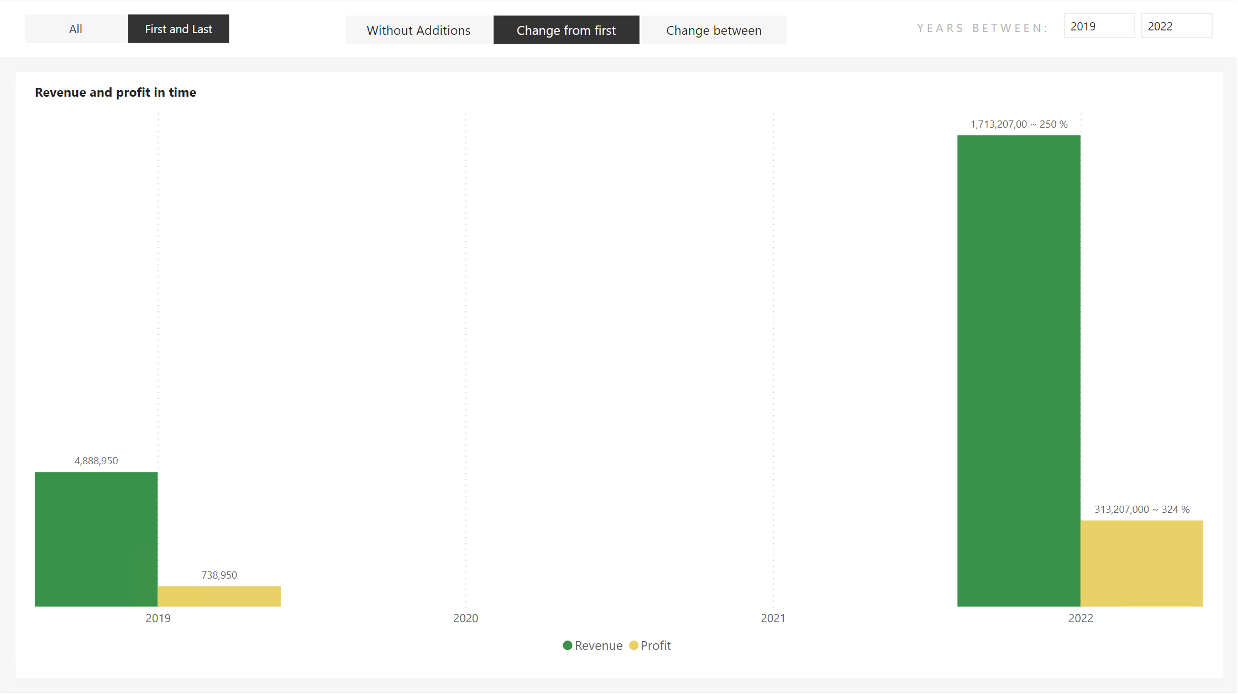 Wrong result in a chart
Hmm, something needs to be fixed! Please take a look at the values in 2022. They don’t fit at all! The original values were [Revenue = 17 132 070] and [Profit = 3 132 070], but the new values are [Revenue 1 713 207 00] and [Profit = 313 207 000]. The differences between the values are pronounced! Where our modified Format String is applied, there is a value shift equal to X*100, this can be seen from Profit, but another strange phenomenon can be seen in Revenue! And the last three digits of the original value are now only 2. How is it possible?
Everything is based on the format string and its manipulation. As part of the number definition, wildcards are used in its definition. For example, # for dynamically inserting numbers into a place and 0 for static, respectively, means that if there is a 0 in the string, its place will always be occupied by a number. If there are not enough digits, then the number 0 will come instead of this position. But it works so that this character is omitted if there are not enough numbers.
Example: 10000.01 with different formats:
- #,,#.### = 10,000.01
- #,,#.000 = 10,000.010
But that’s still not all. Another element that “voluntarily” manipulates the output is the “%” sign, which, at the moment it is used, puts itself in the role of shifting the values so that, from its point of view, they are percentages. So X*100 & %.
These two issues lead me to think that if I have a 0 character in the resulting percentage, a number from the original value will be substituted for each zero. At the same time, the initial value will be adjusted to %. If only there were a way to prevent this… THERE IS! It is the character “\”. If placed before any character in the Format string, the given character is treated as a real character, not a manipulator.
Change from the first Update
It is necessary to use the SUBSTITUTE function on the result returned by the FORMAT function and, in a way, comment out the characters that can cause problems!
ALLSELECTED ( DateKey[Year] )
VAR _lastYear =
INDEX ( -1, _insertedTable, ORDERBY ( DateKey[Year] ) )
VAR _last =
CALCULATE ( SELECTEDMEASURE (), _lastYear )
VAR _first =
CALCULATE (
SELECTEDMEASURE (),
INDEX ( 1, _insertedTable, ORDERBY ( DateKey[Year] ) )
)
VAR _divFormat =
IF (
_lastYear <> SELECTEDVALUE ( DateKey[Year] ),
"",
VAR _div =
DIVIDE ( _last - _first, _first )
VAR _format =
FORMAT ( _div, "# %" )
VAR _substitute =
SUBSTITUTE ( SUBSTITUTE ( _format, "0", "\0" ), "%", "\%" )
RETURN
" ~ " & _substitute
)
RETURN
CONCATENATEX ( { SELECTEDMEASUREFORMATSTRING (), _divFormat }, [Value], " " )
Expression modified. What about the chart?
 Correct results
Well great! It’s already looking good. We could add markers from the character map that tell straight away whether it is a positive or negative change.
- ▲ – Positive
- ▼ – Negative
ALLSELECTED ( DateKey[Year] )
VAR _lastYear =
INDEX ( -1, _insertedTable, ORDERBY ( DateKey[Year] ) )
VAR _last =
CALCULATE ( SELECTEDMEASURE (), _lastYear )
VAR _first =
CALCULATE (
SELECTEDMEASURE (),
INDEX ( 1, _insertedTable, ORDERBY ( DateKey[Year] ) )
)
VAR _divFormat =
IF (
_lastYear <> SELECTEDVALUE ( DateKey[Year] ),
"",
VAR _div =
DIVIDE ( _last - _first, _first )
VAR _upOrDown =
SWITCH ( TRUE (), _div = 0, "", _div > 0, "▲ ", "▼ " )
VAR _format =
FORMAT ( _div, "# %" )
VAR _substitute =
SUBSTITUTE ( SUBSTITUTE ( _format, "0", "\0" ), "%", "\%" )
RETURN
" ~ " & _upOrDown & _substitute
)
RETURN
CONCATENATEX ( { SELECTEDMEASUREFORMATSTRING (), _divFormat }, [Value], " " )
 Correct results with additional chars
Looks great! Even if we switch to “ALL” in the first calculation group, everything works perfectly!
 Correct results with “ALL” item selected.
We have finished this item! Let’s go to the last one left.
Change between
The beginning will be the same! Expression = SELECTEDMEASURE(), nothing wrong with that. What about the Format String Expression? After all, I already said in the introduction that the INDEX only moves somewhat dynamically because it uses absolute coordinates within the provided view. The view can be narrowed down, for example, using the PARTITIONBY() function (link to the documentation)), but we will need more here when we need to make a dynamic shift. It could help us when the user selects in the previous calculation group that it should again be the first and last year from the selection, but otherwise, not much. So let’s go back to the function I discussed in the previous article, the OFFSET() function.
The rest of the calculation will then be the same. We have to decide that if “ALL” is selected in the first calculation group, then the OFFSET option is used; otherwise, the INDEX option is used to get the values into the “_prev” variable. Calculation Items have their Order and names. Both can be used. Now, to simplify the entry, I will use the variant with Order, which I mentioned here in the second part of the article.
This slight adjustment is more than enough for us! In short, if ALL is selected, then OFFSET is evaluated; otherwise, INDEX is evaluated. It is simple. The current value is also evident here because we can get it via SELECTEDMEASURE() into the “_actual” variable. If it occurs to you that we could have done this for the previous item as well, i.e., replace the “_last” parameter, then, of course, you are right! However, even there, it would be enough to use SELECTEMEASURE().
So the entire Expression could look like this, for example:
ALLSELECTED ( DateKey[Year] )
VAR _lastYear =
INDEX ( 1, _insertedTable, ORDERBY ( DateKey[Year] ) )
VAR _actual =
SELECTEDMEASURE ()
VAR _prev =
IF (
SELECTEDVALUE ( indexCalculationGroup[Ordinal] ) = 1,
CALCULATE ( SELECTEDMEASURE (), _lastYear ),
CALCULATE ( SELECTEDMEASURE (), OFFSET ( -1, _insertedTable ) )
)
VAR _divFormat =
IF (
_lastYear = SELECTEDVALUE ( DateKey[Year] ),
"",
VAR _div =
DIVIDE ( _actual - _prev, _prev )
VAR _upOrDown =
SWITCH ( TRUE (), _div = 0, "", _div > 0, "▲ ", "▼ " )
VAR _format =
FORMAT ( _div, "# %" )
VAR _substitute =
SUBSTITUTE ( SUBSTITUTE ( _format, "0", "\0" ), "%", "\%" )
RETURN
" ~ " & _upOrDown & _substitute
)
RETURN
CONCATENATEX ( { SELECTEDMEASUREFORMATSTRING (), _divFormat }, [Value], " " )
Even our chart thinks so!
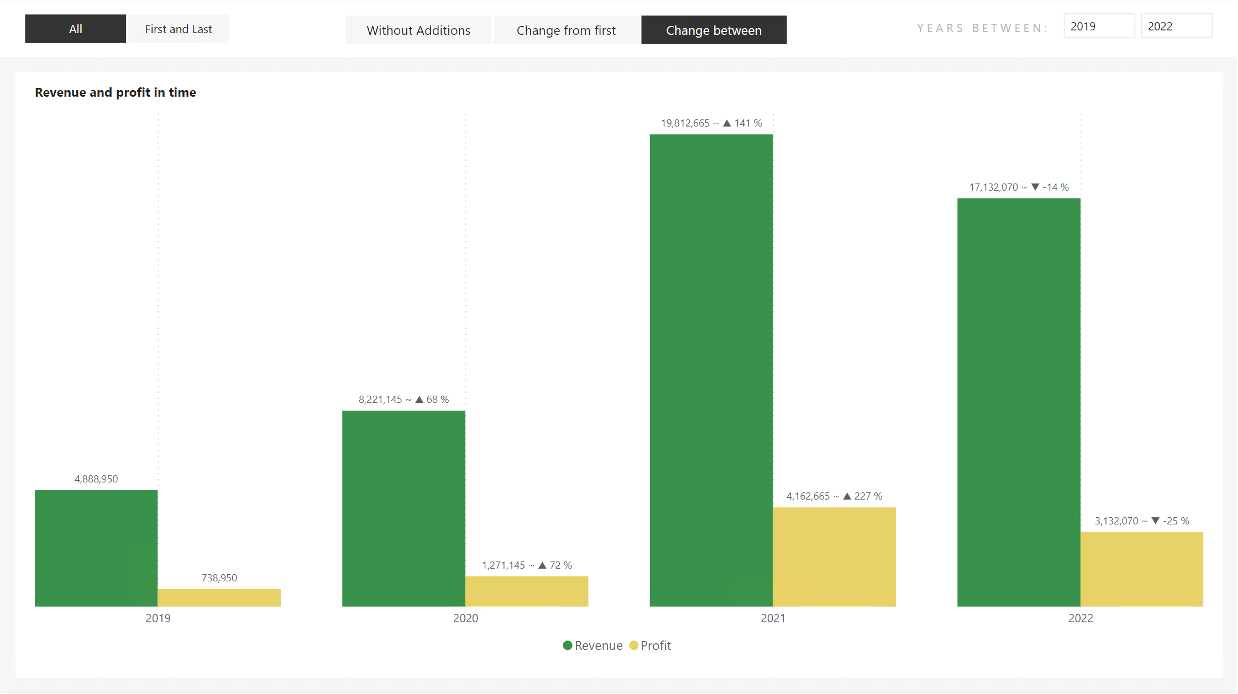 Active change between with “ALL” item
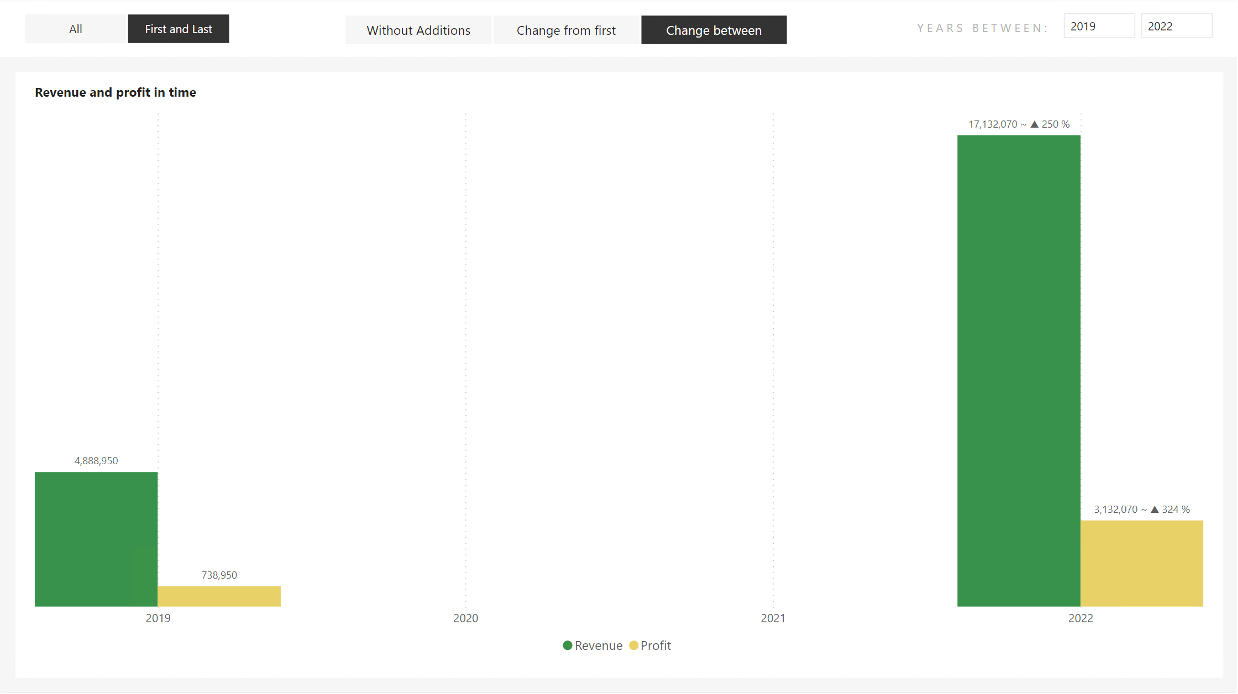 Active change between with “First and Last” item
I skipped a step! What? The fact that I would let this item be realized using OFFSET only. I said it wasn’t the best idea and bypassed it with an index. If we left it all on OFFSET, we would have to ensure that only YEARS with values come into its input table. When “First and Last” is selected, only the years 2019 and 2022 are included in the calculation, and the years 2020 and 2021 are not affected. Which, at this point, would be much more complicated than just skipping it and letting INDEX do its job. And that he does a great job!
Summary
Don’t underestimate a feature because you don’t immediately see its use. Sometimes you can’t see the forest through the chips.
I will not be avoiding the INDEX function because, from my point of view, it is exquisite and accurate. But, at the same time, its use will be much more, not only in the direction of formatting. But somewhere, you will start with it, understand how it works, and apply it further. So I hope this article helped you understand at least one possible scenario of its use.
Great articles about these new functions: