


The DAX OFFSET function has been talked about for a while now. The main entry point to this function for almost everyone was the article by Marc Lelijveld - How to OFFSET in DAX would make your life easier. He describes all the essential info about it in his article. And today, it was officially released as a part of the latest update! https://powerbi.microsoft.com/en-us/blog/power-bi-december-2022-feature-summary/
Function targets the ability to shift over the input dimension along the Y-axis or its rows. Both upwards and downwards. But how exactly it works is explained by Thomas Martens in this his article: Unlock an ample new world by seeing through a window
Such shifts are practical in many cases, for example, in period-over-period calculations, near points calculations, etc. And indeed, it can be used to calculate fundamental values from cumulations.
So if I stick to the idea, I would like to calculate the original values from the cumulated ones. It would be worth considering how many columns we would like to convert this way and if it would be worth reaching for something like calculation groups.
Typically, we would instead solve the problem in reverse. From the source data, we would do cumulation or prepare a breakdown of values already in Power Query or any transformation activity we would use. However, we do not have this option this time. Because we got a PBIX file attached to such data, we don’t have access to solve it elsewhere.
Demo data and targeting the first column
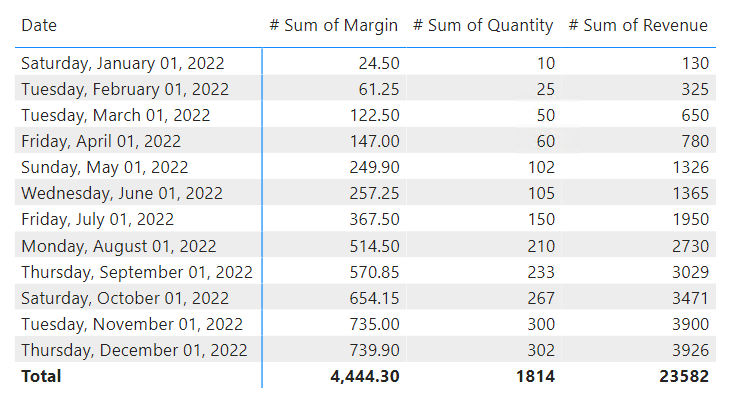
The data looks like this:
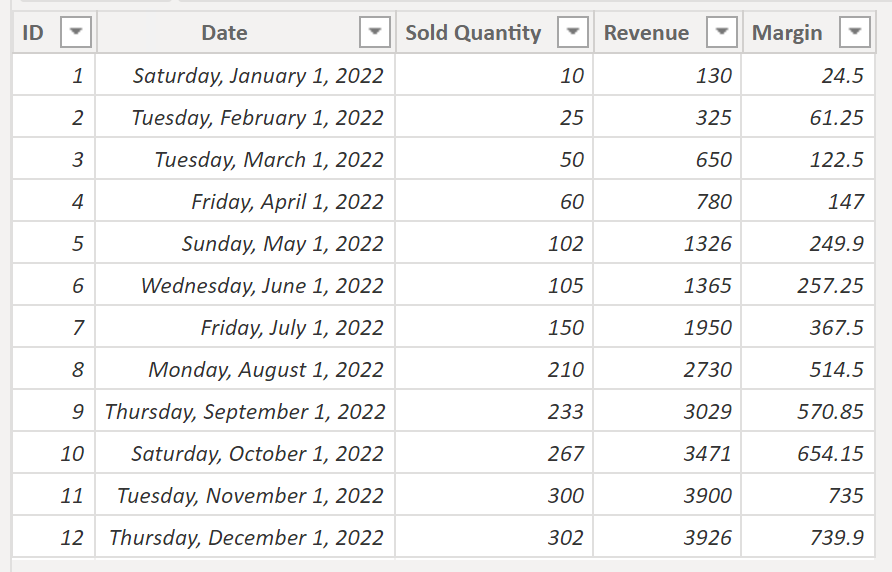 The table that is used for the demonstration of OFFSET
So we have a simple table that contains the Date, number of units sold, revenue, and margin. All cumulated over one year and related to the first day of the month. Of course, it would be possible to break down such a table without the OFFSET function, but why not use it? When it’s new. It may save us much time.
Let’s start easy. So we will start by redoing the entire table at once, but we will start with one column, [Sold Quantity].
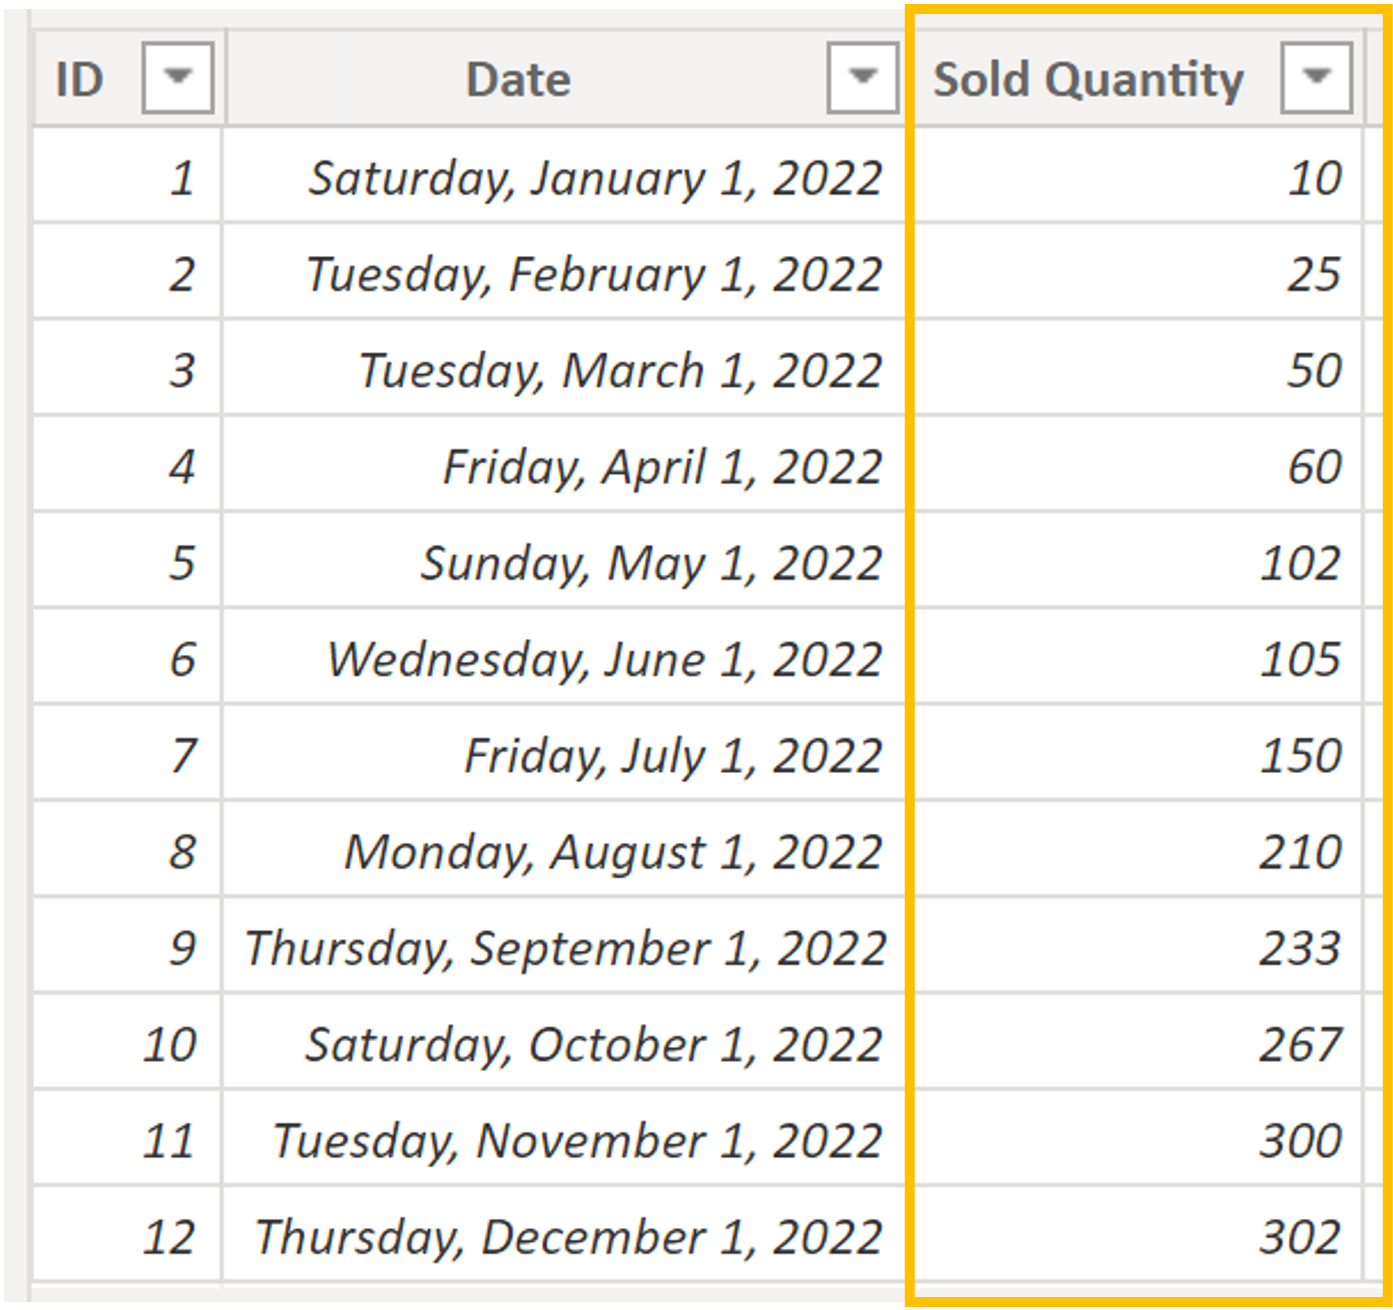 Highlighted cumulated column - Sold Quantity
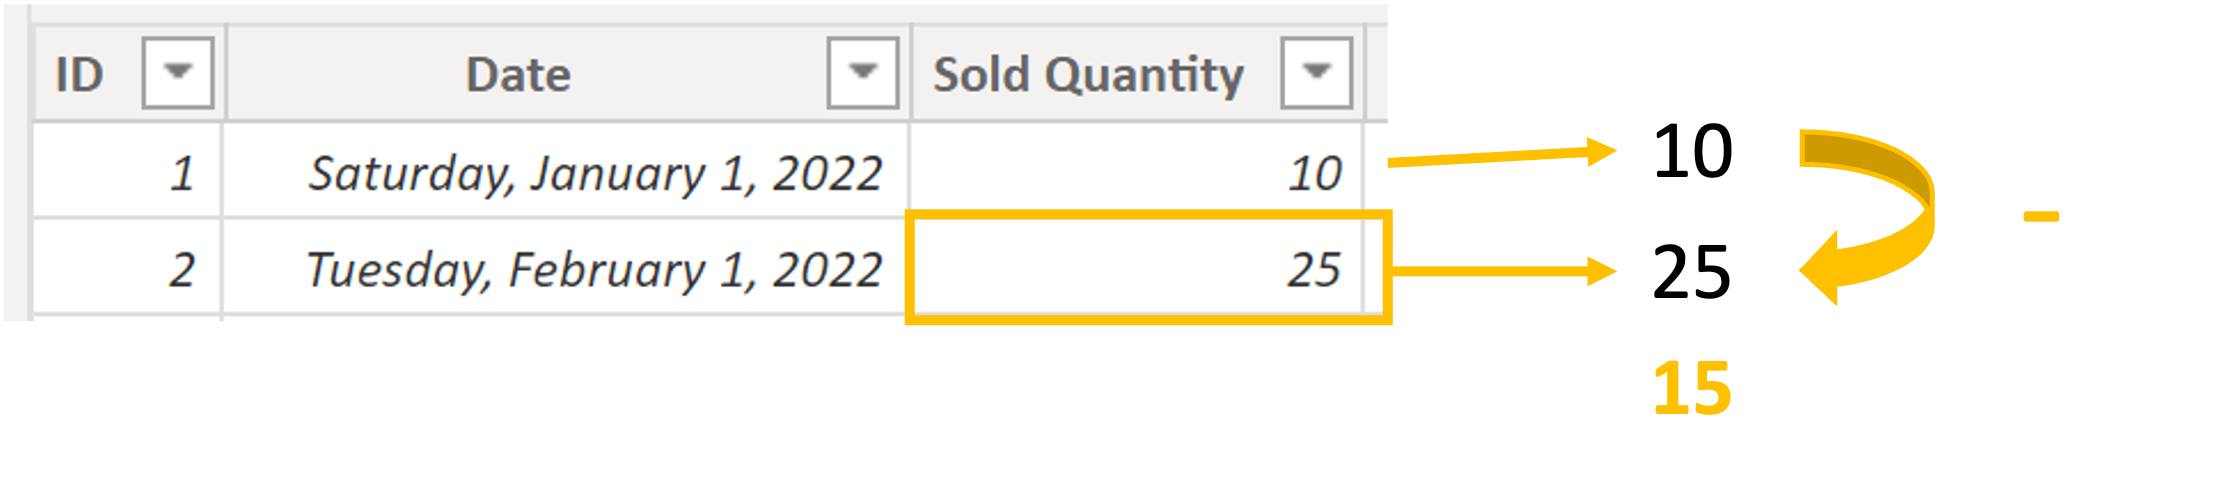
Therefore, it is necessary to take each value within this column and subtract from it the previous value, i.e., ROW-1.
 Basic offset calculation
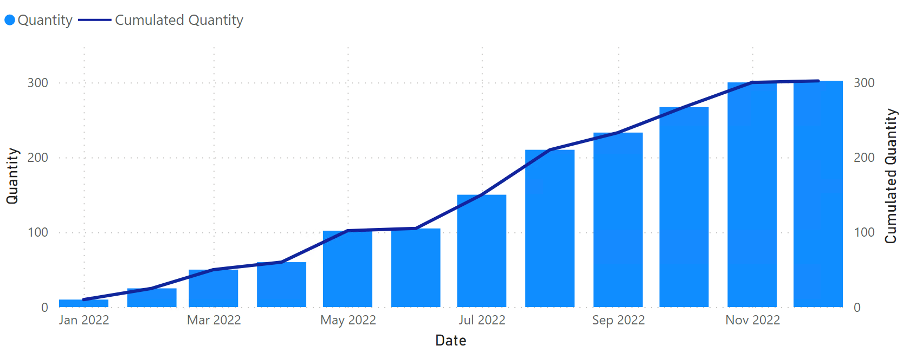
That’s the only bit of theory needed for this. So that the intended problem can be shown well, I will put the original values in the combined graph at the level of the lines. After all, these values represent cumulation, so the individual points have a relationship between them.
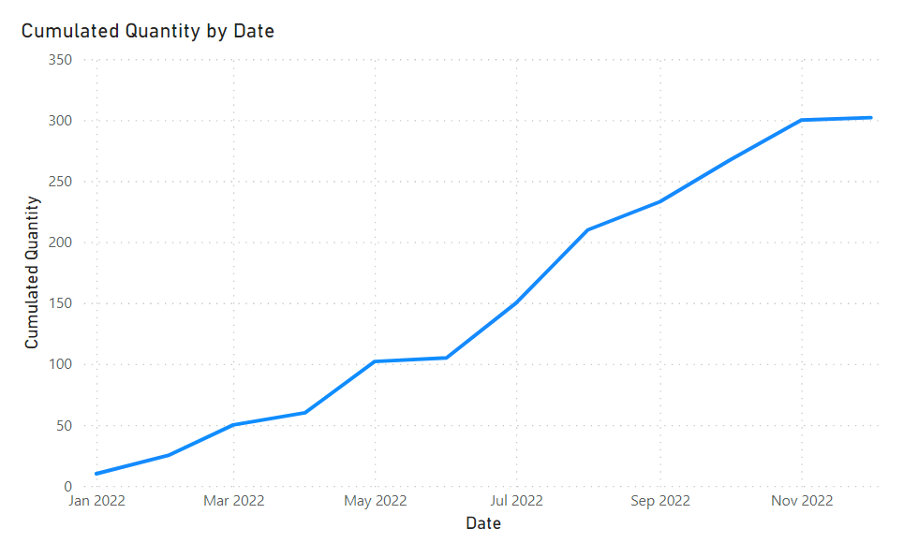 Cumulated Quantity as a line chart
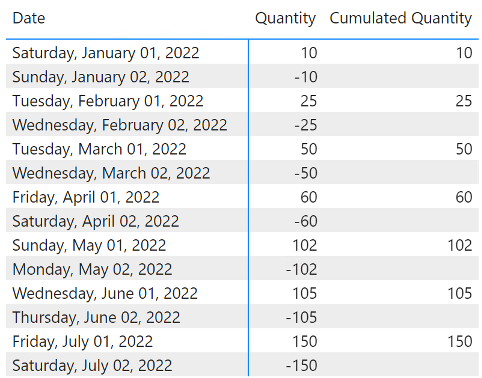
In Show as a Table, where you can get to via the three dots on the visual, you can find specific values displayed for individual points in the graph.
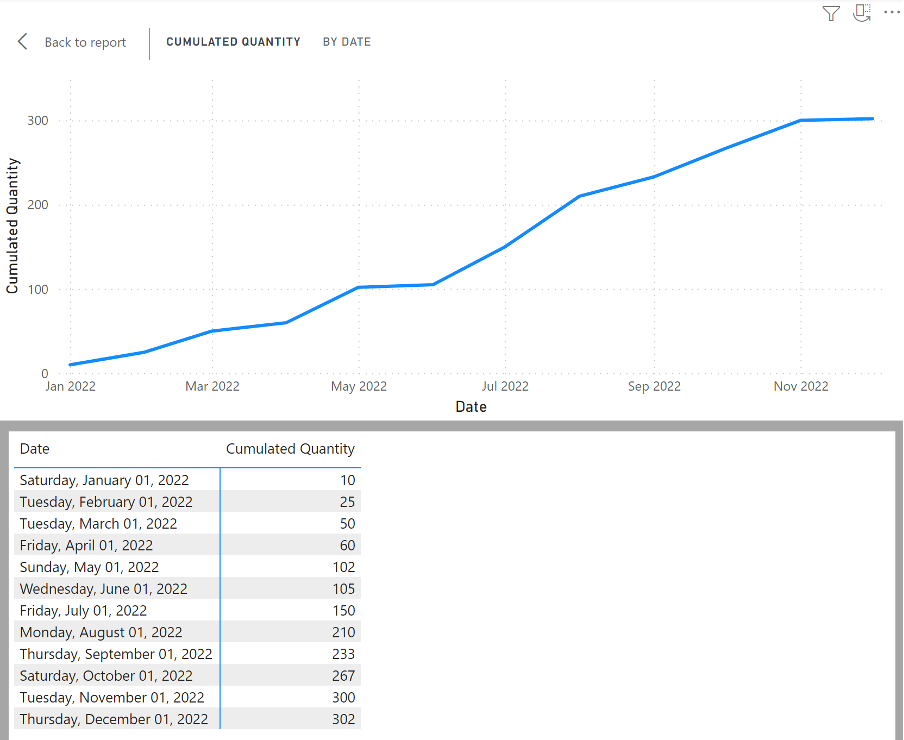 Cumulated Quantity chart - Show as a Table
This display is reasonably practical when working with the OFFSET function because you can see the outputs immediately and don’t have to search for individual values.
I now have the data sorted, so I don’t have to manipulate the data anymore, even though the other new features were mentioned in the Power BI Next Step and then again in the article. ( ORDERBY() function ) In any case, it is enough to prepare a measure that tells exactly what it should do via the first two parameters of the OFFSET function.
VAR _actual =
SUM ( cData[Sold Quantity] )
VAR _prev =
CALCULATE (
SUM ( cData[Sold Quantity] ),
OFFSET ( -1, ALLSELECTED ( cData[Date] ) )
)
RETURN
_actual - _prev
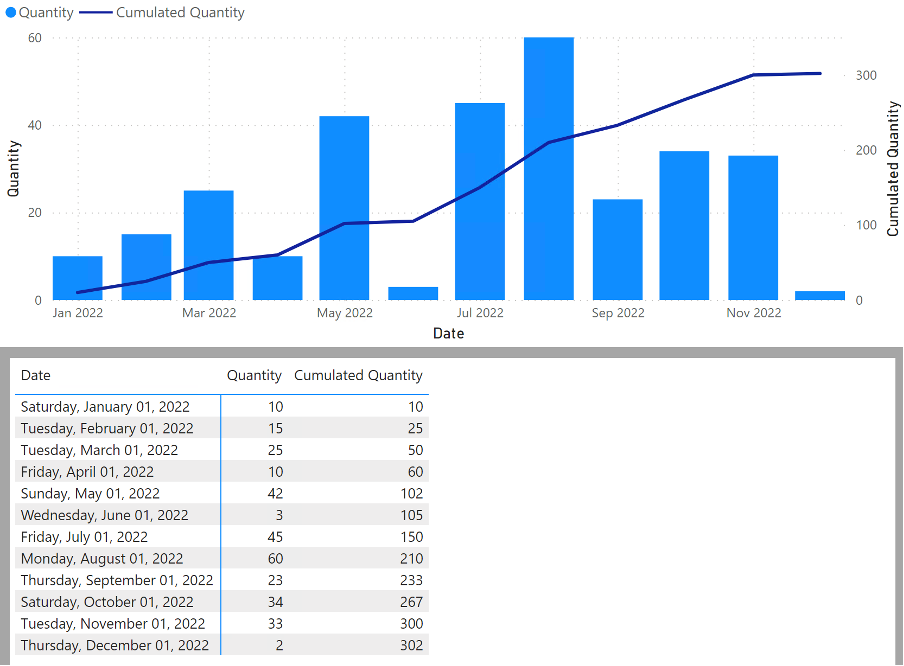
This measure works very well in the chart. It quickly loops through the values on a line, makes their differences, and displays the result within columns. If we then played with this graph a little, those columns could explain beautifully why there was or was not an increase within the cumulative line.
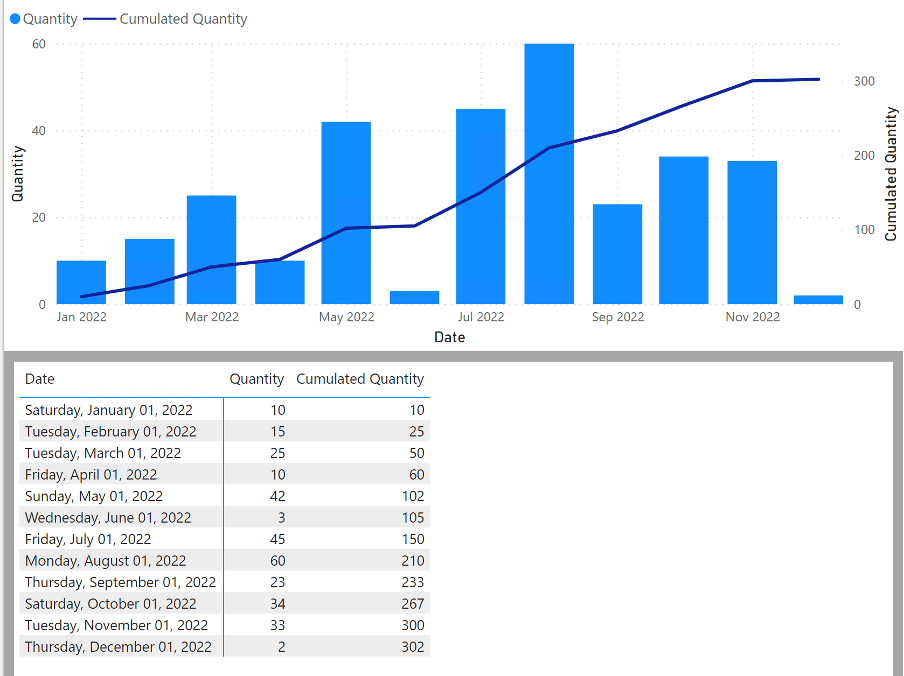 Result of Offseted Quantity
That was easy. So let’s make it closer to a common scenario. Let’s add another table to the game. Specifically, the DateKey table holds individual days for the year 2022 and has the [Date], [Year], and [Month] columns. This table is connected to our original cData table.
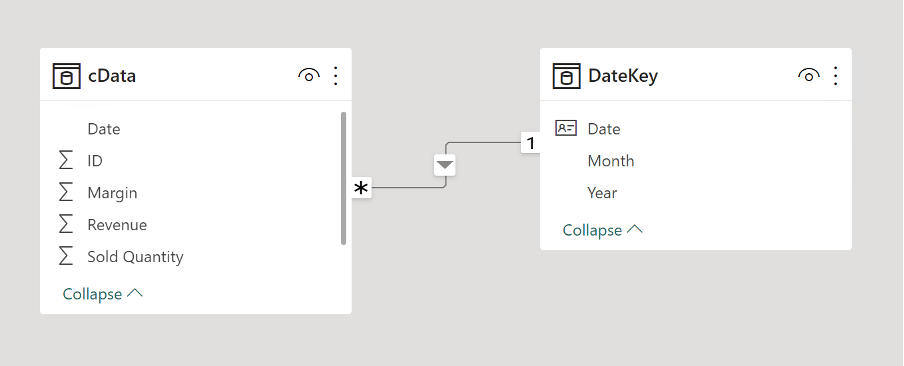 DateKey table added to the model
I have modified the ALLSELECTED function in measure to DateKey[Date] and switched the source on the X-axis to the same column as DateKey. Result?
 Wrong resulted chart after ALLSELECTED modification
Fixing broken result
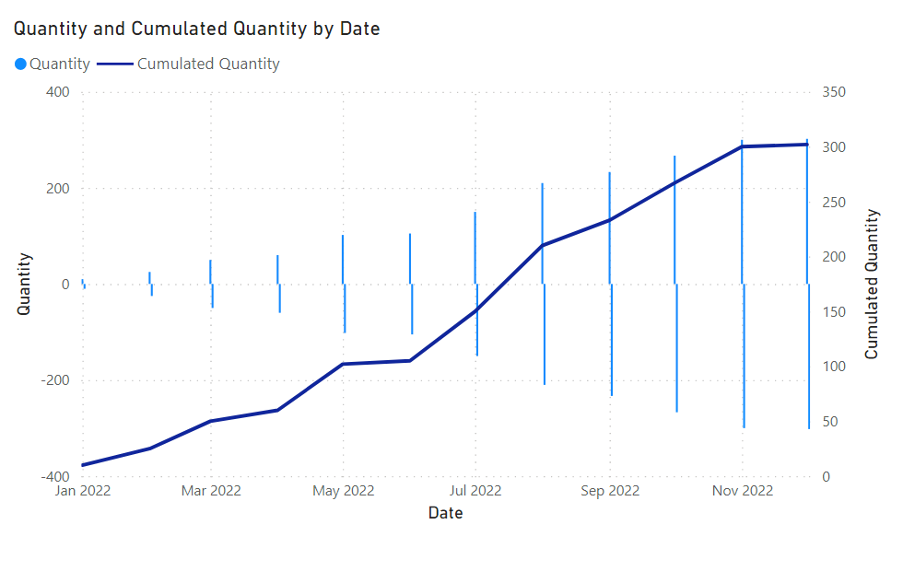
Well… That doesn’t look good. How is it possible? By changing ALLSELECTED in OFFSET, the measure must try to be executed for all values in the new input dimension and where empty outputs are discarded. But now “-1” means that on the second day of the month, the value from the first day is taken and subtracted from nothing. That is the reason why we get a negative return out of nowhere.
At the same time, it is great to see it in Show as a Table within the visual.
 Values of broken chart
We will not get very far even if we filter out data from the output when “_actual” returns an empty value to show the difference accordingly. So that’s how it should work, but to be sure, let’s try it by adding this condition:
VAR _actual =
SUM ( cData[Sold Quantity] )
VAR _prev =
CALCULATE (
SUM ( cData[Sold Quantity] ),
OFFSET ( -1, ALLSELECTED ( DateKey[Date] ) )
)
RETURN
IF ( ISBLANK ( _actual ), BLANK (), _actual - _prev )
And really… It is even worse. Now it only shows “_actual” because when “_prev” would return values, “_actual” is BLANK value every time.
 Debugging wrong results in chart
It is necessary to look at this issue a little differently. First, we know that the shift occurs directly after the entered row within OFFSET. In the second row, we should make such a shift if and only if “_actual” contains values. These two entry requirements must be met for it to make sense. Fortunately, we have captured the second one from the last test using the IF function. Still, how to define a set for displacement? One such possibility is through the intersection of sets. Take the values from DateKey[Date] and cData[Date] and use the INTERSECT function to return only their intersection. So let’s try it out.
VAR _actual =
SUM ( cData[Sold Quantity] )
VAR _prev =
CALCULATE (
SUM ( cData[Sold Quantity] ),
OFFSET (
-1,
CALCULATETABLE (
INTERSECT ( VALUES ( DateKey[Date] ), VALUES ( cData[Date] ) ),
REMOVEFILTERS ( DateKey[Date] )
)
)
)
RETURN
IF ( ISBLANK ( _actual ), BLANK (), _actual - _prev )
 Once again chart is working as we expect.
Hurrah! It works again, and we can move on to the next challenge. How to use it dynamically, so we don’t have to create this function for every possible column. I can already hear the Calculation Group calling in the distance.
Calculation groups with OFFSET
From all the columns, I made a simple aggregation measure ”= SUM(cData[…])” and put them together with the Date from the DateKey into the matrix.
 Cumulated values
We can point a calculation group at them with an item that would modify the existing measures using the modified measure we produced a little while ago, with a slight change.
 Prepared Calculation Group
After activating this item against this matrix, everything looks good. Each column in the matrix was overwritten and immediately subtracted.
 Substracted values
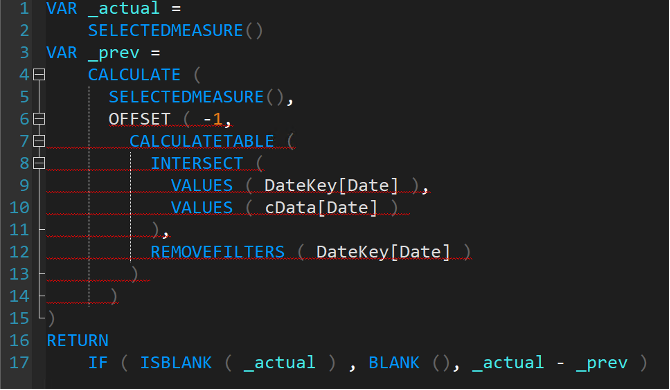
Cool! I wanted to let you know that it works. Dynamic value difference thanks to the combination of OFFSET function and Calculation Group. But… What if we wanted to modify the Format String for the values thus obtained? It should work the same.
Format String Expression with OFFSET
A minor modification to the existing solution adds a simple smiley that should appear if the value exceeds 50.
SELECTEDMEASURE ()
VAR _prev =
CALCULATE (
SELECTEDMEASURE (),
OFFSET (
-1,
CALCULATETABLE (
INTERSECT ( VALUES ( DateKey[Date] ), VALUES ( cData[Date] ) ),
REMOVEFILTERS ( DateKey[Date] )
)
)
)
RETURN
IF ( ISBLANK ( _actual ), BLANK (), IF ( _actual - _prev > 50, "😍", "#.0" ) )
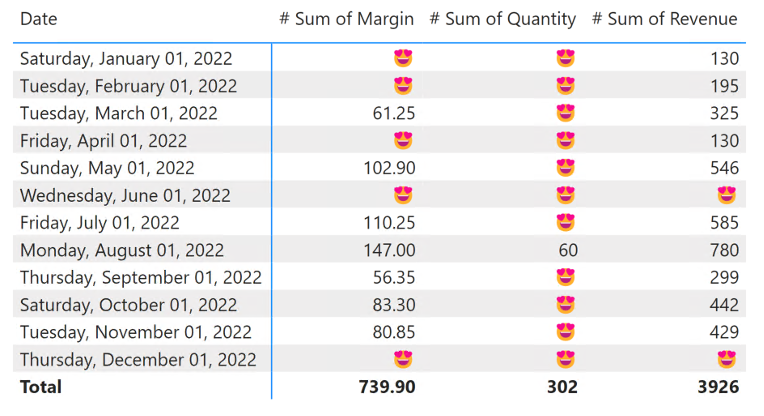
 Smile matrix
What? So there’s something wrong here. The smiley appears at first glance very randomly. It doesn’t matter if the result is >50 or not. At least, it seems that way.
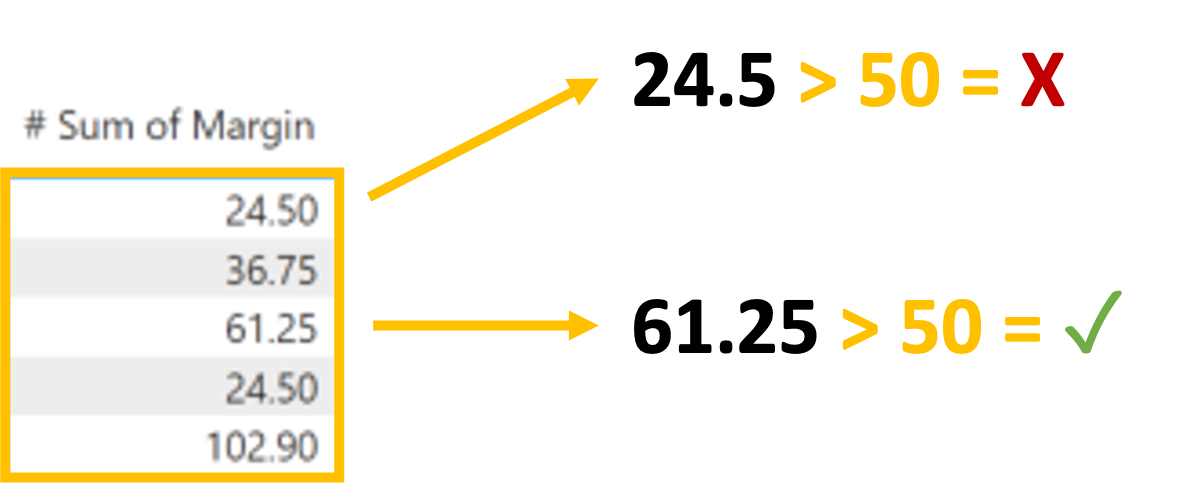 Expected logic behind calculation
Even this simple verification confirms that the result returned to us will be for some other inputs than we would expect because the smiley should also appear at place 61.25.
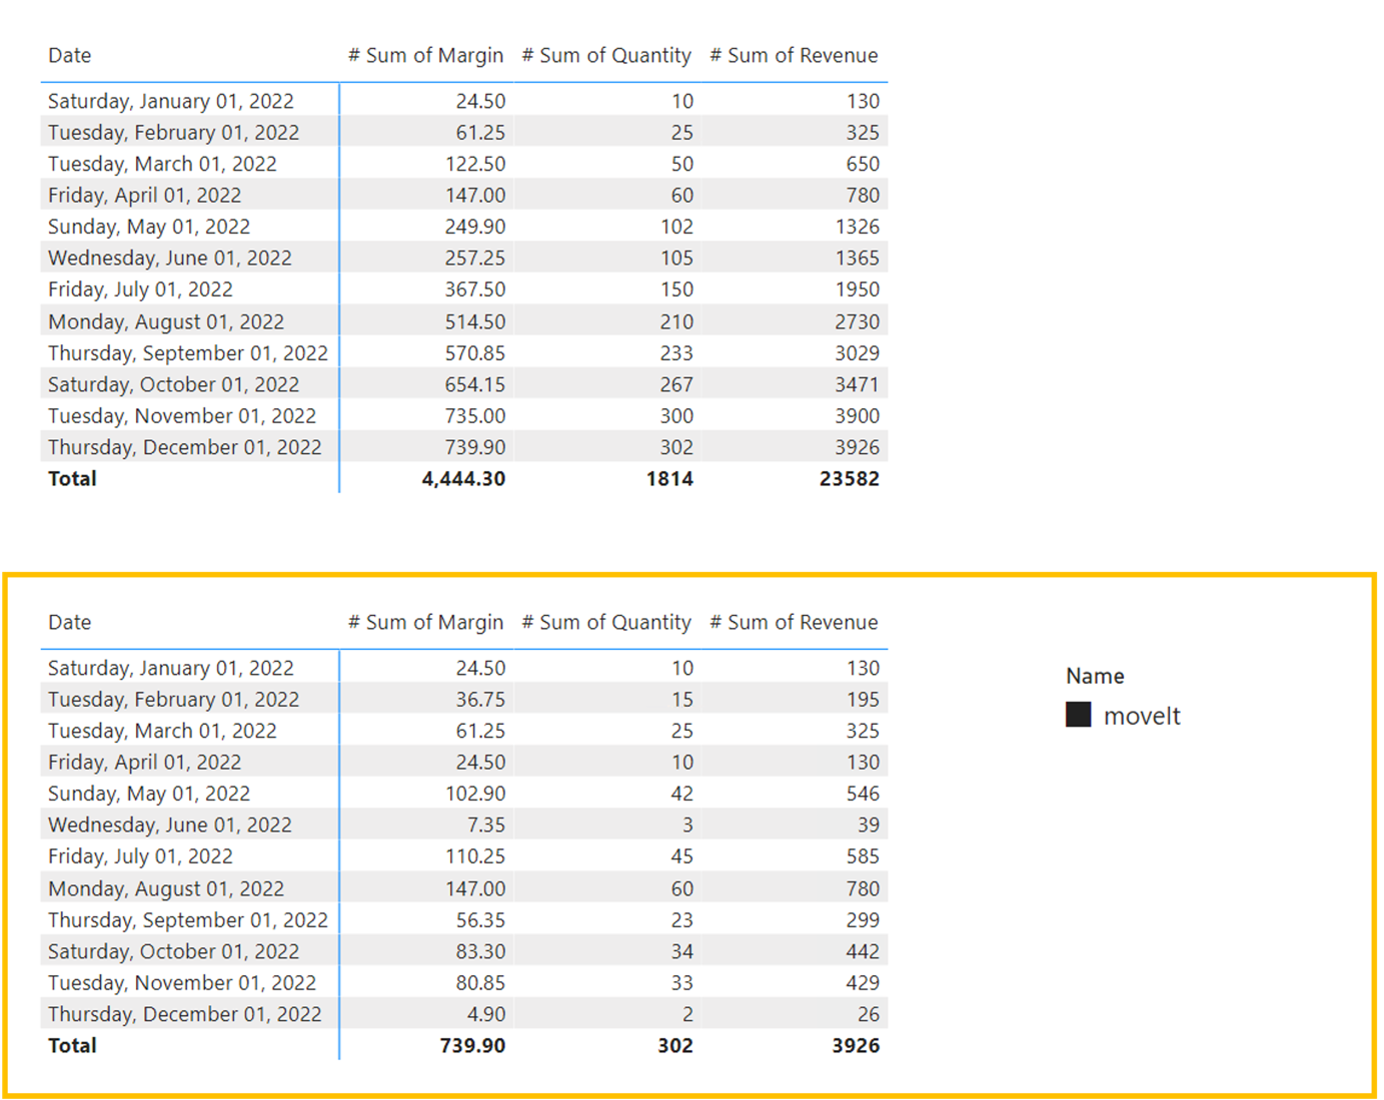
But what if there was a dependent evaluation? The Expression would calculate the first OFFSET shift, and the Format String Expression would then calculate the second shift, which would already be over the calculated values. Wouldn’t it work, then?
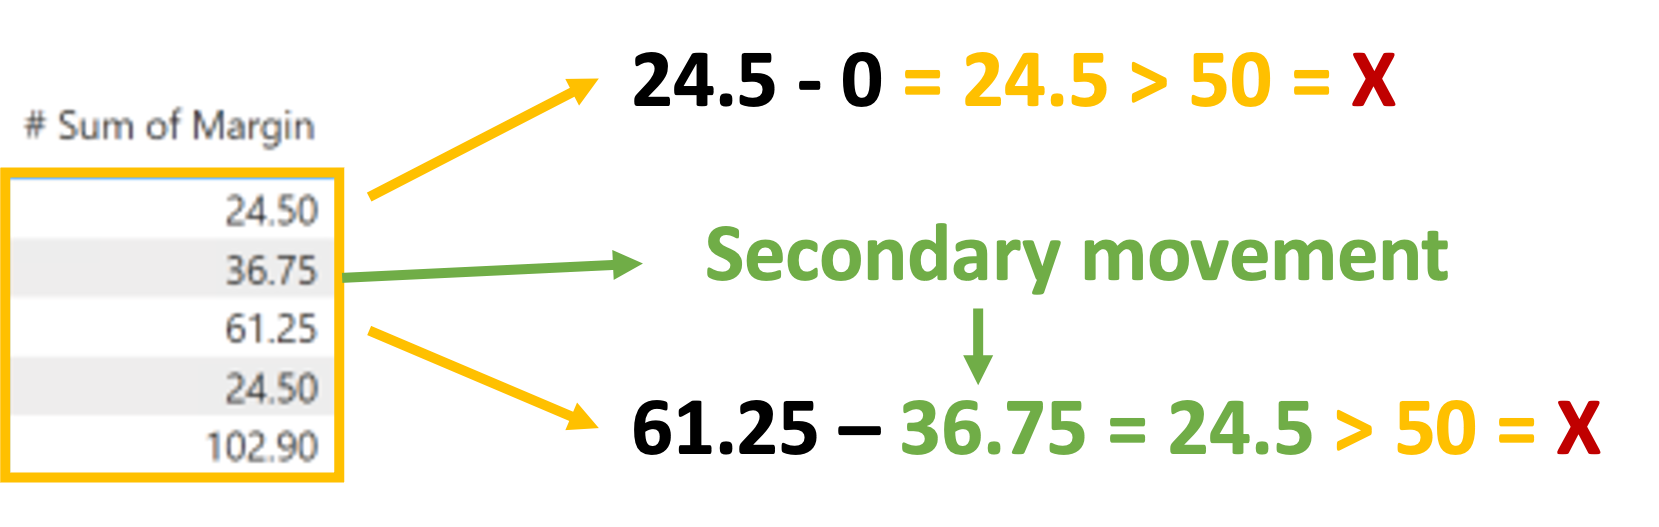 Secondary OFFSET movement
And really! Format String Expression counts values up to the values returned from the Expression, but they are shifted and subtracted, so we are comparing sets that we did not want to compare. To achieve our goal, we would like to directly compare the values output from the Expression.
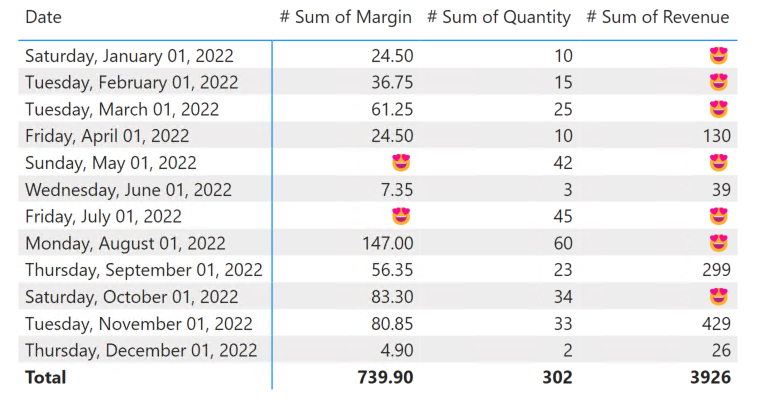
So it should be enough to use SELECTEDMEASURE(), which accepts the current value from the shift performed by the Expression.
 Result matrix with emojies
It works like that!

What if we try to take it to the last level for now? Could you make it attractive with conditional formatting?
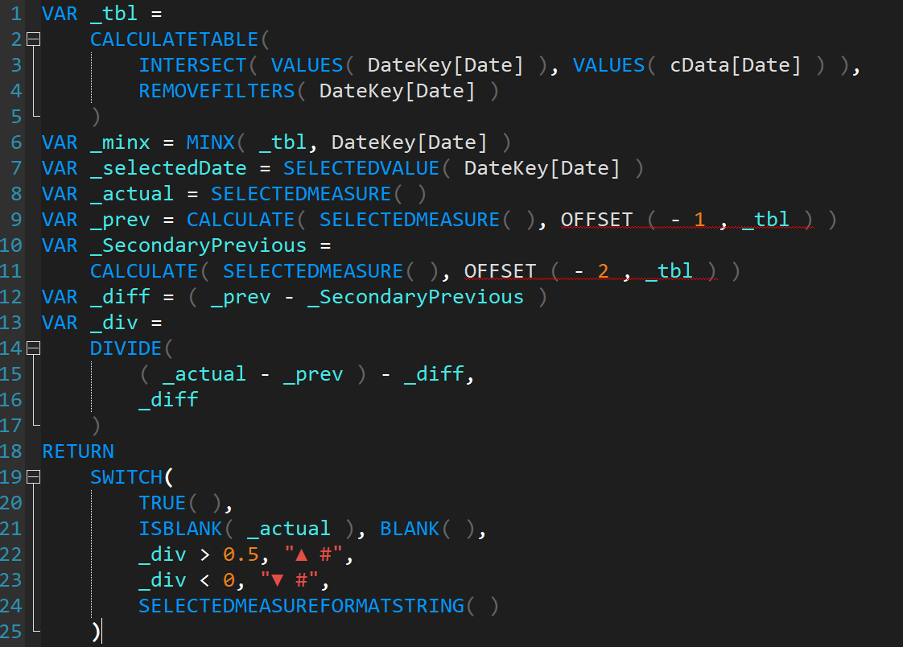
##Conditional Formatting by Calculation Group and OFFSET Would it work to turn it around? First, we would leave the value output at the beginning. Otherwise, we would let the Calculation Group return only the SELECTEDMEASURE() itself in the Expression to leave the data in its original form. Still, we would like to add the identifier of the change within the Format String.
We have a line chart that shows the evolution of our cumulation. We want to calculate the % increases between individual points on it and show either an increase compared to the previous % value or a decrease. So, to find out if the cumulative trend is generally increasing or stagnant in places or decreasing.
 Offset - Format String Expression
To show this, I’ll show this against the measure named [# Sum of Quantity].
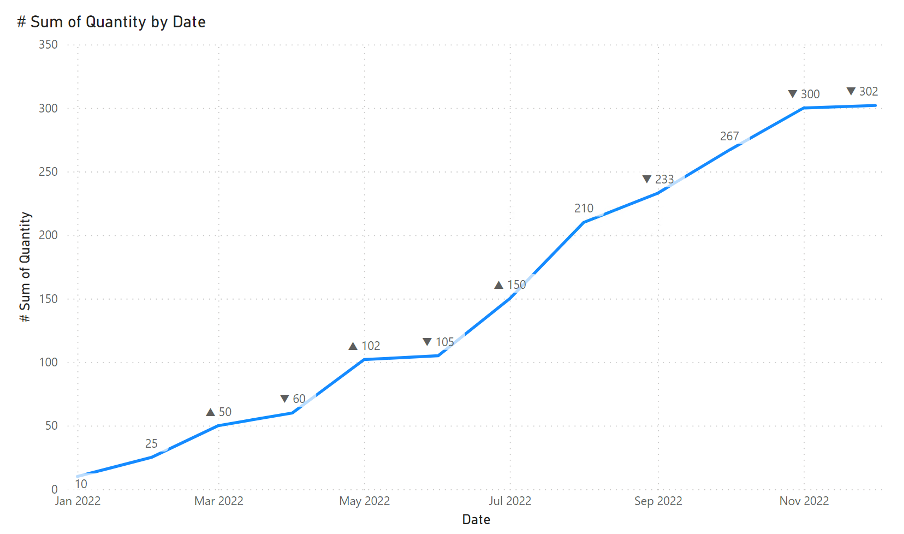 Formatted line chart
Wherever there is more than a 50% increase between unit results,”▲” is displayed where there is a decrease, and “▼” otherwise no added character is displayed.
Summary
This OFFSET is a great function that can make many calculations more straightforward, but it can also mess things up very quickly. I hope this article has helped you understand more about how OFFSET works and how it can be used for different purposes. Please be careful WHERE you will use it. Because it also creates lots of questions.