This topic is familiar, but I have encountered it many times, so I would like to write it down and show it here. The problem is that we have salesmans, who sell individual products, and we want to find out their TOP 3 best-selling products, for example, and their ratio to all the others they sell.
But let’s start step by step. The first step is to get those TOP 3 for each trader. Then we add that other variable as a dynamic overflow of values for all other products into a particular placeholder product to get the resulting ratio.
TOP 3 Products for each Salesman
Preview of the used model:
 Model
Model
In different ways, we can get to that first step, i.e., obtaining the TOP 3 products for individual merchants. The first one that came to my mind is using the RANKX() function, where we assign a rank to each sold amount for a given merchant and filter the result. The metric for this is straightforward:
RANKX ( ALLSELECTED ( Products[Product name] ), [# Total Quantity] )
But it already refers to another metric, so to assure you that there is no additional logic hidden in it, I am attaching it as well:
SUM ( Sales[Quantity] )
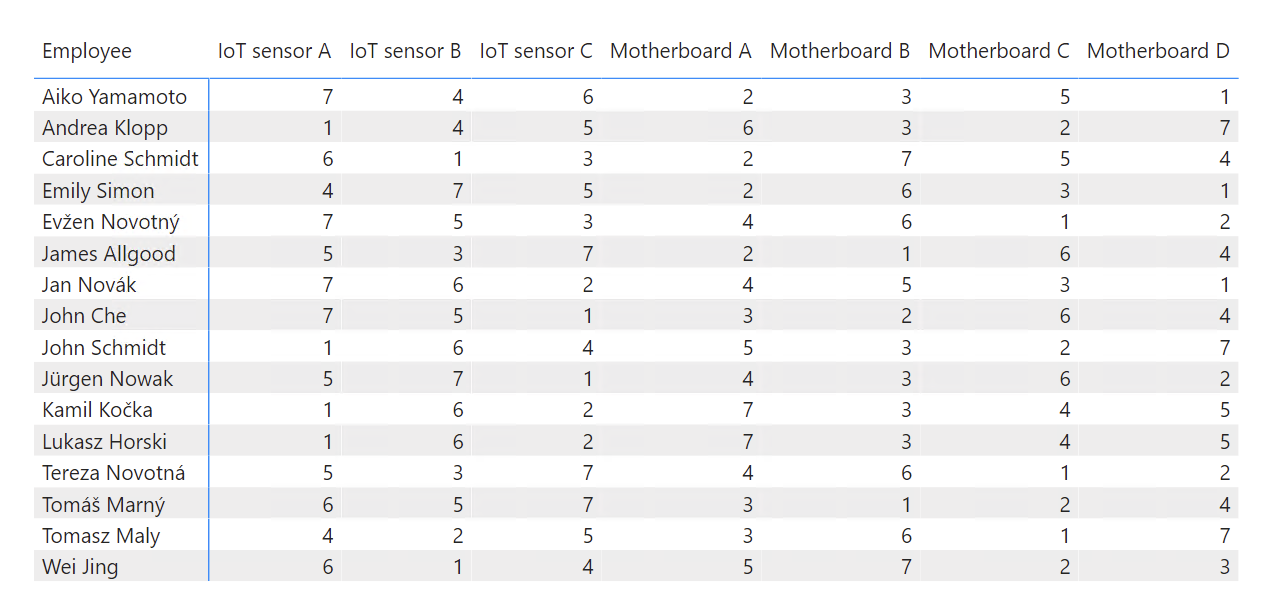
The result will appear in the matrix as predictably. Our ranks add up beautifully.
 Ranked products by the salesman and their sold quantity
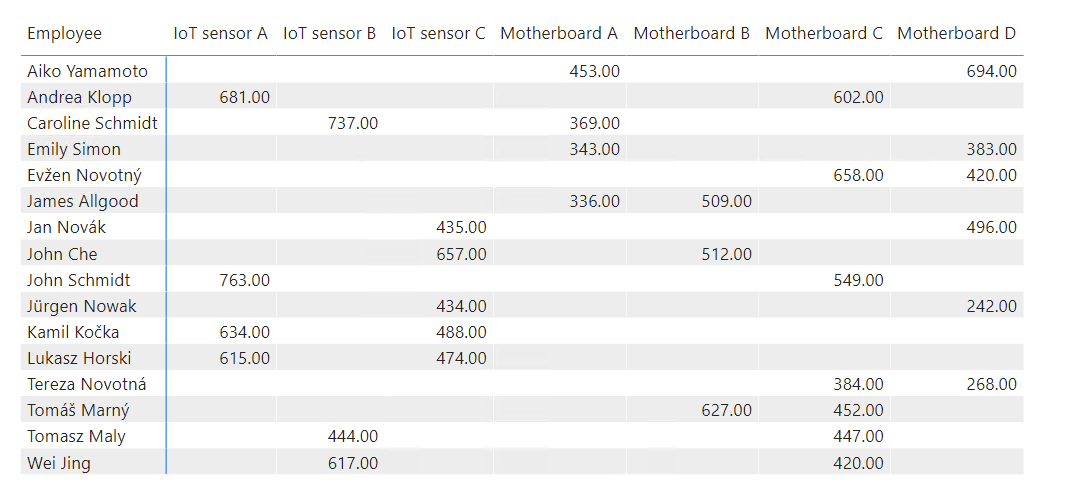
Once we add a bit of logic, we can display only the values that are basically the TOP 3 values.
VAR _rank = [# Rank] RETURN IF ( _rank <= 3, [# Total Quantity], [blank] )
 Shows values with a rank lower than 4
But as I mentioned, RANKX is one of many options we have. So, for example, we could achieve the same thing using the TOPN() function, where we would precalculate the TOPN3 table and subsequently apply filters from the visual to it during the calculation using KEEPFILTERS().
VAR _topn =
TOPN ( 3, ALLSELECTED ( Products[Product name] ), [# Total Quantity] )
RETURN
CALCULATE ( [# Total Quantity], KEEPFILTERS ( _topn ) )
Of course, none of the notations prevents us from adding a significant dose of dynamism to it using the Numeric Range parameter.
 Numeric Range
And after adding add to the calculation.
 TOPN Values by selected parameter
But it must be set to a range, so remember that it is a calculated table that can be expanded dynamically. With a small extension, we will always have the option to select up to the total number of all products.
GENERATESERIES ( 1, COUNTROWS ( VALUES ( Products[Product name] ) ), 1 )
But I deviated a little from the main topic. Back to it and how to make all other products count towards a certain PLACEHOLDER.
Placeholder Product
As usual, we have more options. First of all, it is necessary to consider that this PLACEHOLDER will only be filled using the metric we are preparing, so it does not make sense to add it directly to the product code because it would only confuse other developers or even users who would like to create from our dataset’s reports. So we need to create it as a separate table. We have more and more options, but… I will present at least two. DAX and M variants.
DAX Variant
Within the DAX variety, I reach for the calculated table, using the SELECTCOLUMNS() function to obtain the necessary columns from the current table ‘Products’ and attach their own values to them using the UNION() function, which will serve as the PLACEHOLDER.
VAR _original =
SELECTCOLUMNS (
Products,
"ID", Products[Produkt ID],
"Name", Products[Product name]
)
RETURN
UNION ( _original, { ( COUNTROWS ( _original ) + 1, "PLACEHOLDER" ) } )
 Created products with a placeholder by DAX
M Variant
The same can be done in M. Even with the same type of procedure. Or by taking one Table and adding another to it. Either using the “&” operand or using the Table.Combine() function.
let
    updatedProducts = Products[[Product ID], [Product name]]
        & #table(
            type table [Product ID = number, Product name = text],
            { { List.Count(Products[Product ID]) + 1, "PLACEHOLDER" } }
        )
in
    updatedProducts
Created products with a placeholder by M
It is also possible to extend it using the Table.InsertRows() function, but we only need to connect the tables in this case.
Table.InsertRows(
    Products[[Product ID], [Product name]],
    0,
    {[Product ID = List.Count(Products[Product ID]) + 1, Product name = "PLACEHOLDER"]}
)
Measure update
So whether you choose the first or second option, we must modify our existing metric and model to work with it. So let’s join the created Table using the ID column to the Sales fact table and dive into the metric.
 Modified model
The model must also be adjusted very simply from the point of view of the description of the requirement. We use SELECTEDVALUE() to get the currently evaluated category. If it is a PLACEHOLDER, we calculate the total value for all categories and subtract the value for the categories in the TOPN variable from it.
VAR _selectedProduct =
SELECTEDVALUE ( updatedProducts[Name] )
VAR _topn =
TOPN (
[Parameter Value],
ALLSELECTED ( updatedProducts[Name] ),
[# Total Quantity]
)
RETURN
IF (
_selectedProduct = "PLACEHOLDER",
VAR _total =
CALCULATE ( [# Total Quantity], ALLSELECTED ( updatedProducts[Name] ) )
VAR _topnSum =
SUMX ( _topn, [# Total Quantity] )
VAR _resultPlaceholder = _total - _topnSum
RETURN
_resultPlaceholder,
CALCULATE ( [# Total Quantity], KEEPFILTERS ( _topn ) )
)
Measure adjusted! What about metrics?
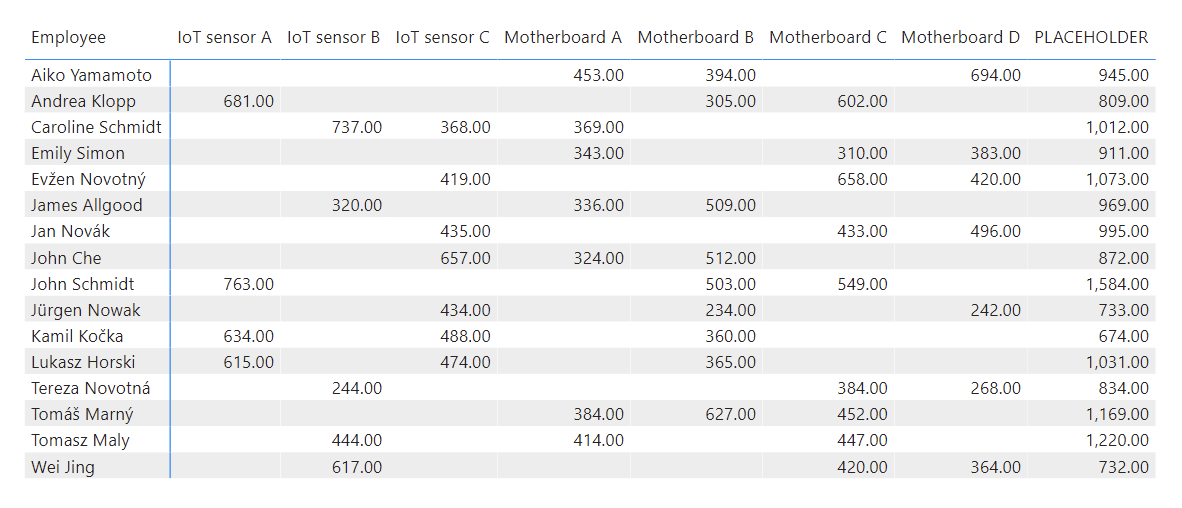
 Matrix with modified measure and witch columns from new table
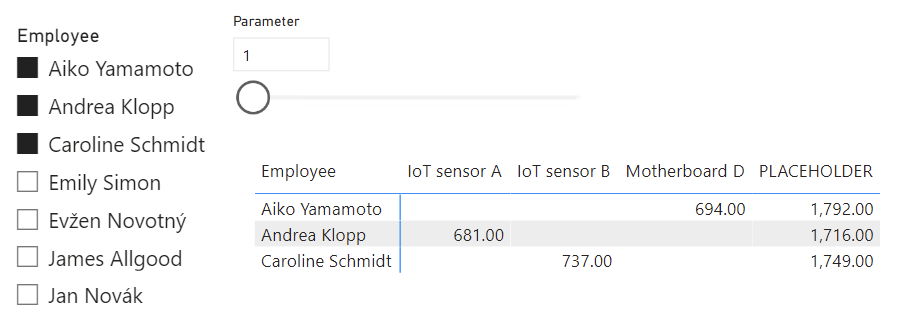
Cool! Everything looks exactly as it should! Even if I change the parameter to 1, I lose some columns because they should contain an empty value in all rows, so they hide.
 Dynamic of disappearing columns in Matrix
Value distribution for Ratio
The ratio is well displayed on 100% bar graphs. And as soon as we switch our matrix to this type of graph, we find that we are very close to the end!
 Ratio in 100% bar chart
Before I start looking back at the style, it’s good to note that it’s correct that we see for each merchant THEIR TOP 3 products, and it’s dynamic, as we would like. But now, something needs to be done with the design to make it readable.
Color change, Axis change, Title modification, Data labels, Background, Legend position…
 Modified matrix
And immediately, the experience is different. In addition to the information we calculated together, I added a dynamic subtitle, adding an explanatory factor to our analytical graph.
It is certainly worth noting that you do not have to use the PLACEHOLDER value but an utterly arbitrary value. Feel free to use the OTHER value, or you don’t have to refer directly using names, but you can extend this type of calculation with categories, separate indexes, etc. The main thing is understanding the principle and realizing what you are trying to achieve.


