


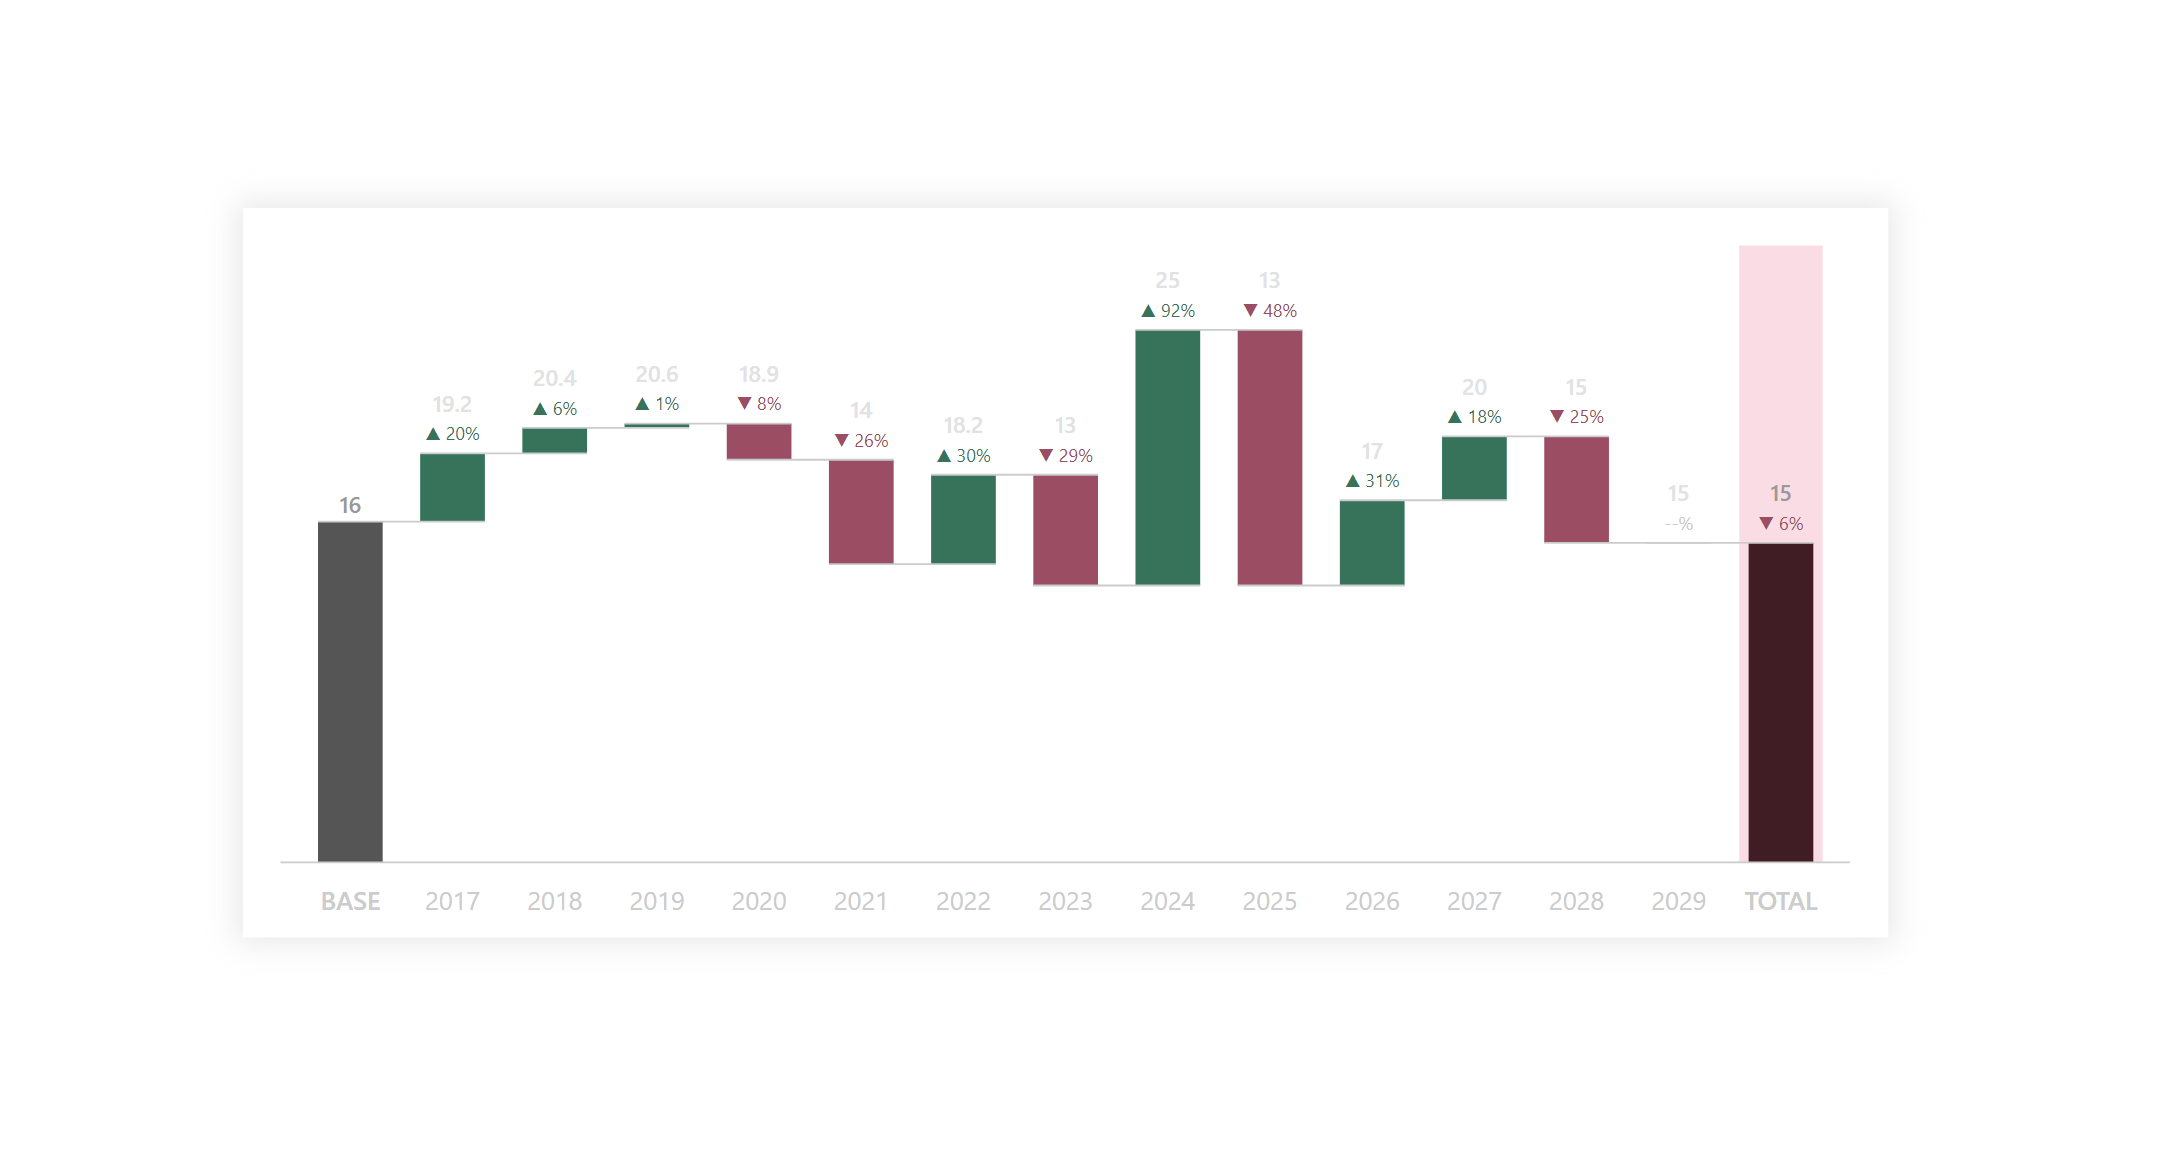
The waterfall chart is viral, especially within the financial sector, because it shows the influence of the company’s decisions and actions well. Those with no base value are much more familiar with a base value on which those influences are shown. Yes, Power BI has its own Waterfall chart, but unfortunately, it does not allow for many adjustments, which is why custom visuals often represent it. So why not enjoy it exactly as we need it but with native visuals?
DAX Template
The description labels within the template should guide you to the individual variables and elements that you can/should modify. Of course, this is a template, so feel free to customize it as much as you would like, this is just a base. Everything else depends on your needs and ideas.
/* SETUP */
VAR _baseValue = <MEASURE OR VALUE> // WILL BE USED AS A BASE VALUE OFR WATERFALL
VAR _initTbl = // ADD YOUR TABLE, PERIOD COLUMN (DATE, MONTH, QUARTER, YEAR,...) + MEASURE HERE
    ADDCOLUMNS (
        SELECTCOLUMNS (
            SUMMARIZE ( <TABLE>, <COLUMN-FOR-DATE-PERIOD> ),
            "@yAxisCategory", <COLUMN-FOR-DATE-PERIOD> ),
        "@vl", <MEASURE>
    )
// CANVAS SIZE
VAR _heightCanvasSize = 350 // Height of the canvas
VAR _widthCanvasSize = 1260 // Width of the canvas
VAR _paddingSpace = 20 // Padding space around the canvas
VAR _requestedSpaceBetweenColumns = 20  // Space between columns

/* END COLUM COLOR DEFINITION */
VAR _positiveTotalHighlightColor = "#C9EDE4"
VAR _positiveTotalColumnColor = "#1A473C"
VAR _negativeTotalHighlightColor = "#FFDBE4"
VAR _negativeTotalColumnColor = "#461924"
/* STYLE DECLARTIONS */
VAR _styles = "
<style>
        text {
            fill: #E2E2E2;
            font-family: 'Segoe UI';
            font-size: 0.85em;
            dominant-baseline: hanging;
            text-anchor: middle;
        }

        .baseTexts{
            fill: #CCCCCC
        }

        .lines {
            fill: none;
            stroke: #CCCCCC
        }

        .initialCol{
            fill: #555555
        }

        .positiveCol {
            fill: #157558
        }

        .negativeCol {
            fill: #A74764
        }

        .neutralCol{
            fill: #CCCCCC
        }

        .resultCol {
            fill: #255CC0
        }

        .vals {
            font-weight: 600;
            font-size: 0.75em;
        }

        .darker{
            fill: #999999
        }

        .percentageChanges {
            font-weight: 400;
            font-size: 0.6em;
        }
    </style>
"

/* SVG DECLARTIONS */
VAR _svgDeclaration = "data:image/svg+xml;utf8,"
VAR _svgHeader = "<svg xmlns='http://www.w3.org/2000/svg' height='" & _heightCanvasSize & "' width='" & _widthCanvasSize & "'>"
VAR _svgEnd = "</svg>"

/* CALCULATION */
VAR _counter =
    COUNTROWS ( _initTbl ) + 2
VAR _doublePadding = _paddingSpace * 2
VAR _usableWidth = ( _widthCanvasSize - _doublePadding )
VAR _usableHeight = ( _heightCanvasSize - ( _doublePadding * 2 ) - 25 )
VAR _xCanvasPoints = _usableWidth / 100
VAR _yCanvasPoints = _usableHeight / 100
VAR _maxValue =
    MAXX ( _initTbl, [@vl] )
VAR _resultSizeOfColumns =
    ABS (
        ROUND (
            DIVIDE (
                _usableWidth - ( ( _counter + 1 ) * _requestedSpaceBetweenColumns ),
                _counter
            ),
            1
        )
    )
VAR _content =
    VAR _endVl =
        MINX ( INDEX ( 1, _initTbl, ORDERBY ( [@yAxisCategory], DESC ) ), [@vl] )
    VAR _firstVl = _baseValue
    /* BASE COLUMN */
    VAR _startYPosition = _usableHeight + _doublePadding + 25
    VAR _startXPosition = _requestedSpaceBetweenColumns + _paddingSpace
    VAR _startPrevYPosition =
        _heightCanvasSize
            - (
                ROUND ( DIVIDE ( _firstVl, _maxValue ) * 100, 1 ) * _yCanvasPoints
            ) - _paddingSpace * 2
    VAR _startXMoving = _startXPosition + _resultSizeOfColumns
    VAR _startLowerYPosition =
        IF (
            _startYPosition > _startPrevYPosition,
            _startPrevYPosition,
            _startYPosition
        )
    VAR _startXPositionMoved = _startXPosition + ( _resultSizeOfColumns / 2 )
    /* TOTAL COLUMN */
    VAR _endYPosition = _usableHeight + _doublePadding + 25
    VAR _endXPosition = ( ( _counter - 1 ) * _resultSizeOfColumns ) + ( _requestedSpaceBetweenColumns * _counter ) + _paddingSpace
    VAR _endPrevYPosition =
        _heightCanvasSize
            - (
                ROUND ( DIVIDE ( _endVl, _maxValue ) * 100, 1 ) * _yCanvasPoints
            ) - _paddingSpace * 2
    VAR _endXMoving = _endXPosition + _resultSizeOfColumns
    VAR _endLowerYPosition =
        IF ( _endYPosition > _endPrevYPosition, _endPrevYPosition, _endYPosition )
    VAR _endXPositionMoved = _endXPosition + ( _resultSizeOfColumns / 2 )
    VAR _endColor =
        IF ( _endVl > _firstVl, _positiveTotalHighlightColor , _negativeTotalHighlightColor )
    VAR _endBarColor =
        IF (
            _endVl > _firstVl,
            _positiveTotalColumnColor
            ,_negativeTotalColumnColor
        )
    RETURN
        "
    <g stroke='none'>
    <path class='initialCol' d='M " & _startXPosition & " " & _startYPosition & " V " & _startPrevYPosition & " H " & _startXMoving & " V " & _startYPosition & " Z'/>" & "<text class='baseTexts' font-weight='600' x='" & _startXPositionMoved & "' y='" & _heightCanvasSize - _paddingSpace - ( _paddingSpace / 3 ) & "'> BASE </text>
    <text class='vals darker' x='" & _startXPositionMoved & "' y='" & _startLowerYPosition - 15 & "'> " & _firstVl & " </text>
    " // --------------------------------------------------------------------
            & CONCATENATEX (
                _initTbl,
                VAR _row =
                    ROWNUMBER ( _initTbl, ORDERBY ( [@yAxisCategory], ASC ), DEFAULT ) + 1
                VAR _vl = [@vl]
                VAR _prevVl =
                    VAR _prev =
                        OFFSET ( -1, _initTbl )
                    RETURN
                        IF ( _row = 2, _baseValue, CALCULATE ( MINX ( _prev, [@vl] ) ) )
                VAR _yPosition =
                    _heightCanvasSize
                        - (
                            ROUND ( DIVIDE ( _vl, _maxValue ) * 100, 1 ) * _yCanvasPoints
                        ) - _paddingSpace * 2
                VAR _prevYPosition =
                    _heightCanvasSize
                        - (
                            ROUND ( DIVIDE ( _prevVl, _maxValue ) * 100, 1 ) * _yCanvasPoints
                        ) - _paddingSpace * 2
                VAR _xPosition = ( ( _row - 1 ) * _resultSizeOfColumns ) + ( _requestedSpaceBetweenColumns * _row ) + _paddingSpace
                VAR _xMoving = _xPosition + _resultSizeOfColumns
                VAR _lowerYPosition =
                    IF ( _yPosition > _prevYPosition, _prevYPosition, _yPosition )
                RETURN
                    "<path class='"
                        & SWITCH (
                            TRUE (),
                            _vl > _prevVl, "positiveCol",
                            _vl < _prevVl, "negativeCol",
                            "neutralCol"
                        ) & "' d='M " & _xPosition & " " & _yPosition & " V " & _prevYPosition & " H " & _xMoving & " V " & _yPosition & " Z'/>" & "<text class='baseTexts' x='" & _xPosition + ( _resultSizeOfColumns / 2 ) & "' y='" & _heightCanvasSize - _paddingSpace - ( _paddingSpace / 3 ) & "'> " & [@yAxisCategory] & " </text>" & "<text class='vals' x='" & _xPosition + ( _resultSizeOfColumns / 2 ) & "' y='"
                        & _lowerYPosition
                            - IF ( _row = 1, 15, 32.5 ) & "'> " & _vl & " </text>" & "<text class='vals percentageChanges "
                        & SWITCH (
                            TRUE (),
                            _vl > _prevVl, "positiveCol",
                            _vl < _prevVl, "negativeCol",
                            "neutralCol"
                        ) & "' x='" & _xPosition + ( _resultSizeOfColumns / 2 ) & "' y='" & _lowerYPosition - 15 & "'> "
                        & FORMAT ( DIVIDE ( _vl, _prevVl ) - 1, "▲ 0%;▼ 0%;--%" ) & " </text>",
                "",
                [@yAxisCategory], ASC
            ) // --------------------------------------------------------------------
        & "<rect x='" & _endXPosition - ( _requestedSpaceBetweenColumns * 0.25 ) & "' width='" & _resultSizeOfColumns + ( _requestedSpaceBetweenColumns * 0.5 ) & "' y='" & _paddingSpace & "' height='" & _usableHeight + 25 + _paddingSpace & "' fill='" & _endColor & "' />" & "<path fill='" & _endBarColor & "' d='M " & _endXPosition & " " & _endYPosition & " V " & _endPrevYPosition & " H " & _endXMoving & " V " & _endYPosition & " Z'/>" & "<text class='baseTexts' font-weight='600' x='" & _endXPositionMoved & "' y='" & _heightCanvasSize - _paddingSpace - ( _paddingSpace / 3 ) & "'> TOTAL </text>
    <text class='vals darker' x='" & _endXPositionMoved & "' y='" & _endLowerYPosition - 32.5 & "'> " & _endVl & " </text>
    <text class='vals percentageChanges "
            & SWITCH (
                TRUE (),
                _endVl > _firstVl, "positiveCol",
                _endVl < _firstVl, "negativeCol",
                "neutralCol"
            ) & "' x='" & _endXPositionMoved & "' y='" & _endLowerYPosition - 15 & "'> "
            & FORMAT ( DIVIDE ( _endVl, _firstVl ) - 1, "▲ 0%;▼ 0%;--%" ) & " </text>
    </g>" /* LINES */
VAR _lines =
    VAR _endVl =
        MINX ( INDEX ( 1, _initTbl, ORDERBY ( [@yAxisCategory], DESC ) ), [@vl] )
    VAR _endXPosition = ( ( _counter - 1 ) * _resultSizeOfColumns ) + ( _requestedSpaceBetweenColumns * _counter ) + _paddingSpace
    VAR _endPrevYPosition =
        _heightCanvasSize
            - (
                ROUND ( DIVIDE ( _endVl, _maxValue ) * 100, 1 ) * _yCanvasPoints
            ) - _paddingSpace * 2
    VAR _endXPrevPosition = ( ( _counter - 2 ) * _resultSizeOfColumns ) + ( _requestedSpaceBetweenColumns * ( _counter - 1 ) ) + _paddingSpace
    RETURN
        "<g class='lines'>" & "<path d='M " & _paddingSpace & " " & _heightCanvasSize - ( _paddingSpace * 2 ) & " H " & _widthCanvasSize - _paddingSpace & "' />" & "<path d='"
            & CONCATENATEX (
                _initTbl,
                VAR _row =
                    ROWNUMBER ( _initTbl, ORDERBY ( [@yAxisCategory], ASC ), DEFAULT ) + 1
                VAR _prevVl =
                    VAR _prev =
                        OFFSET ( -1, _initTbl )
                    RETURN
                        IF ( _row = 2, _baseValue, CALCULATE ( MINX ( _prev, [@vl] ) ) )
                VAR _prevYPosition =
                    _heightCanvasSize
                        - (
                            ROUND ( DIVIDE ( _prevVl, _maxValue ) * 100, 1 ) * _yCanvasPoints
                        ) - _paddingSpace * 2
                VAR _xPosition = ( ( _row - 1 ) * _resultSizeOfColumns ) + ( _requestedSpaceBetweenColumns * _row ) + _paddingSpace
                VAR _xPrevPosition = ( ( _row - 2 ) * _resultSizeOfColumns ) + ( _requestedSpaceBetweenColumns * ( _row - 1 ) ) + _paddingSpace
                RETURN
                    " M " & _xPrevPosition & " " & _prevYPosition & " H " & _xPosition + _resultSizeOfColumns
            ) & "' />" & "<path d=' M" & _endXPrevPosition & " " & _endPrevYPosition & " H " & _endXPosition + _resultSizeOfColumns & "' />" & "</g>"
VAR _result = _svgDeclaration & _svgHeader & _styles & _content & _lines & _svgEnd
RETURN
    _result
Power BI Core Visuals supporting this template
Like most other SVGs that we want to dynamically generate, we can use them within three native visuals.
- Matrix
- New Card
- Table
The template is again aimed more at use within the new CARD visual, but with a bit of MACGyver work, it could also be used well in the other options mentioned. However, the maintenance would then be significantly higher.
Set up of new Card visual
- Visual
- Values: Off
- Layout
- Vertical alignment: Middle
- Cards
- Padding: Custom -> 0px (all)
- Image: On
- Image type: Image URL
- Image Url: fx
- Transparency: 0%
- Position: Bottom
- Padding: 0px
- Size: Auto
- General
- Size
- Width: 1260px
- Height: 350px
- Padding: 0px (all)
- Size