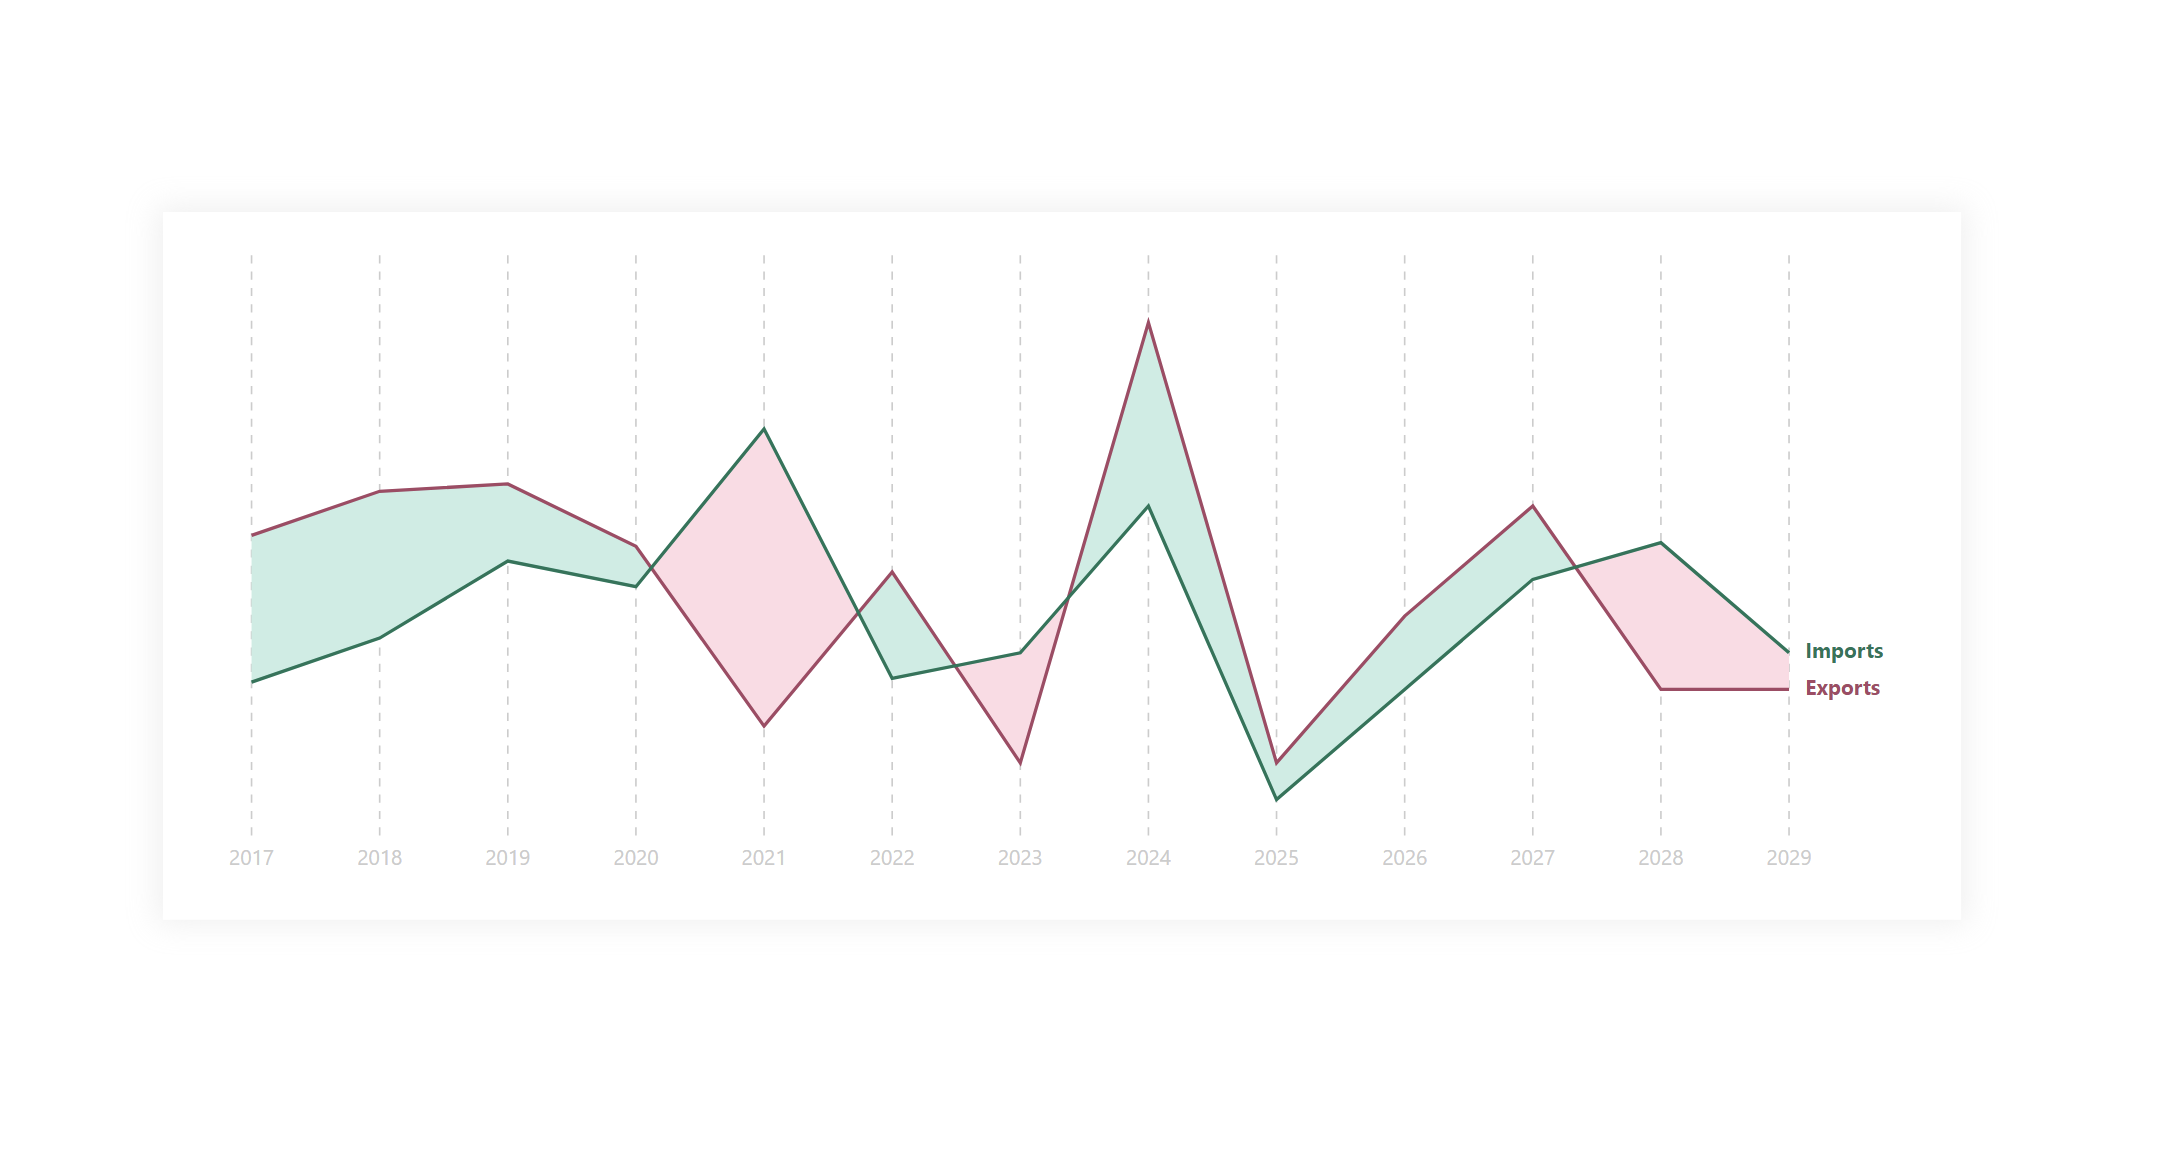
This variant of the line chart colors a conditional color between the individual colors, with this coloring, it supports the understanding of changes between individual points in the chart.
DAX Template
The description labels within the template should guide you to the individual variables and elements that you can/should modify. Of course, this is a template, so feel free to customize it as much as you would like, this is just a base. Everything else depends on your needs and ideas.
/* SETUP */
VAR _initTbl = // ADD YOUR TABLE, PERIOD COLUMN (DATE, MONTH, QUARTER, YEAR,...) + MEASURES HERE
    ADDCOLUMNS (
        SELECTCOLUMNS ( SUMMARIZE ( <TABLE>, <COLUMN-FOR-DATE-PERIOD> ), "@yAxisCategory", <COLUMN-FOR-DATE-PERIOD> ),
        "@firstLine", <MEASURE-1>,
        "@secondLine", <MEASURE-2>
    )
VAR _height = 405 // Height of canvas
VAR _width = 1100 // Width of canvas
VAR _paddingSpace = 15 // Padding space between canvas and chart
VAR _firstLineText = "Exports" // End Label for first measure
VAR _secondLineText = "Imports"  // End Label for second measure

/* COLORS DECLARTIONS */
VAR _firstLineColor = "#A74764"
VAR _secondLineColor = "#157558"
VAR _green = "#C9EDE4"
VAR _red = "#FFDBE4"
VAR _grey = "#CCCCCC"

/* SVG DECLARTIONS */
VAR _svgDeclaration = "data:image/svg+xml;utf8,"
VAR _svgHeader = "<svg xmlns='http://www.w3.org/2000/svg' height='" & _height & "' width='" & _width & "'>"
VAR _svgEnd = "</svg>"

/* CALCULATION */
VAR _tblPrecalculation =
    ADDCOLUMNS (
        _initTbl,
        "@positionChanged",
            VAR _rowNumber =
                ROWNUMBER ( _initTbl, ORDERBY ( [@yAxisCategory], ASC ) )
            RETURN
                IF (
                    IF ( [@firstLine] >= [@secondLine], 1, 0 )
                        = MINX ( OFFSET ( -1, _initTbl ), IF ( [@firstLine] >= [@secondLine], 1, 0 ) )
                        \|| \_rowNumber = 1,
                    BLANK (),
                    1
                ),
        "@clrSetter", IF ( [@firstLine] >= [@secondLine], 1, 0 ),
        "@rowNum", ROWNUMBER ( _initTbl, ORDERBY ( [@yAxisCategory], ASC ) )
    )
VAR _counter =
    COUNTROWS ( _tblPrecalculation )
VAR _doublePadding = _paddingSpace * 2
VAR _usableWidth = ( _width - 50 - _doublePadding )
VAR _usableHeight = ( _height - _doublePadding )
VAR _xCanvasPoints = _usableWidth / 100
VAR _highestValueOfMeasures =
    MAXX ( _tblPrecalculation, MAX ( [@firstLine], [@secondLine] ) ) * 1.1
VAR _lowestValueOfMeasures =
    MINX ( _tblPrecalculation, MIN ( [@firstLine], [@secondLine] ) ) * 0.90
VAR _paddingSpaceBetweenPoitns = _usableWidth / _counter
VAR _precountOfSegments =
    COUNTAX ( _tblPrecalculation, [@positionChanged] ) + 1
VAR _generateSpaceForSegments =
    GENERATESERIES ( 1, _precountOfSegments, 1 )
VAR _differenceBetweenPositions = _highestValueOfMeasures - _lowestValueOfMeasures
VAR _percentModificator = 100 / _highestValueOfMeasures
VAR _tblCoordinatesPreCalculation =
    ADDCOLUMNS (
        _tblPrecalculation,
        "@xCoordinates",
            VAR _perc = ( [@firstLine] * _percentModificator ) * _xCanvasPoints
            RETURN
                _paddingSpace + [@rowNum] * _paddingSpaceBetweenPoitns - _paddingSpaceBetweenPoitns * ( 1 / 2 ),
        "@yCoordinatesForFirstLine",
            (
                1
                    - DIVIDE ( [@firstLine] - _lowestValueOfMeasures, _differenceBetweenPositions )
            ) * _usableHeight,
        "@yCoordinatesForSecondLine",
            (
                1
                    - DIVIDE ( [@secondLine] - _lowestValueOfMeasures, _differenceBetweenPositions )
            ) * _usableHeight
    )
VAR _tblConnectionPoints =
    ADDCOLUMNS (
        _tblCoordinatesPreCalculation,
        "@LinesConnection",
            IF (
                NOT ISBLANK ( [@positionChanged] ),
                VAR _offset =
                    OFFSET ( -1, _tblCoordinatesPreCalculation ) // X Shared Positions
                VAR _x1 = [@xCoordinates]
                VAR _xMoved =
                    CALCULATE ( MINX ( _offset, [@xCoordinates] ) ) // FIRST LINE Y Position
                VAR _y1 = [@yCoordinatesForFirstLine]
                VAR _y2 =
                    CALCULATE ( MINX ( _offset, [@yCoordinatesForFirstLine] ) ) // SECOND LINE Y Position
                VAR _y3 = [@yCoordinatesForSecondLine]
                VAR _y4 =
                    CALCULATE ( MINX ( _offset, [@yCoordinatesForSecondLine] ) ) // NEW POSITIONS
                VAR _x =
                    DIVIDE (
                        ( ( _y2 - _y1 ) * ( _xMoved - _x1 ) * _x1 ) + ( ( _xMoved - _x1 ) * ( _xMoved - _x1 ) * ( _y3 - _y1 ) ) - ( ( _y4 - _y3 ) * ( _xMoved - _x1 ) * _x1 ),
                        ( ( _y2 - _y1 ) * ( _xMoved - _x1 ) ) - ( ( _xMoved - _x1 ) * ( _y4 - _y3 ) )
                    )
                VAR _y =
                    DIVIDE (
                        ( _x * ( _y2 - _y1 ) ) + ( _y1 * ( _xMoved - _x1 ) ) - ( _x1 * ( _y2 - _y1 ) ),
                        _xMoved - _x1
                    )
                RETURN
                    _x & " " & _y,
                BLANK ()
            )
    )
VAR _line =
    "<g stroke-width='2' fill='none'>" & "<path stroke='" & _firstLineColor & "' d='"
        & CONCATENATEX (
            _tblCoordinatesPreCalculation,
            IF ( [@rowNum] = 1, "M", " L " ) & [@xCoordinates] & " " & [@yCoordinatesForFirstLine]
        ) & "' />" & "<path stroke='" & _secondLineColor & "' d='"
        & CONCATENATEX (
            _tblCoordinatesPreCalculation,
            IF ( [@rowNum] = 1, "M", " L " ) & [@xCoordinates] & " " & [@yCoordinatesForSecondLine]
        ) & "' />" & "</g>"
VAR _segmentsFirstLine =
    CONCATENATEX (
        _tblConnectionPoints,
        " "
            & IF (
                ISBLANK ( [@positionChanged] ),
                [@xCoordinates] & " " & [@yCoordinatesForFirstLine],
                \[@LinesConnection] & \" | \" & \[@LinesConnection] & \" L \" & \[@xCoordinates] & \" \" & \[@yCoordinatesForFirstLine]
            ),
        "",
        [@yAxisCategory], ASC
    )
VAR _segmentsSecondLine =
    CONCATENATEX (
        _tblConnectionPoints,
        " "
            & IF (
                ISBLANK ( [@positionChanged] ),
                " " & [@xCoordinates] & " " & [@yCoordinatesForSecondLine],
                \" \" & \[@xCoordinates] & \" \" & \[@yCoordinatesForSecondLine] & \" | \"
            ),
        "",
        [@yAxisCategory], DESC
    )
VAR _segments =
    "<g stroke='none'>"
        & CONCATENATEX (
            _generateSpaceForSegments,
            VAR _rowValue =
                IF (
                    [Value] = 1,
                    SELECTCOLUMNS (
                        TOPN ( 1, _tblConnectionPoints, [@yAxisCategory], ASC ),
                        "@forInternalPurpose", [@clrSetter]
                    ),
                    SELECTCOLUMNS (
                        TOPN (
                            1,
                            TOPN (
                                [Value] - 1,
                                FILTER ( _tblConnectionPoints, NOT ISBLANK ( [@positionChanged] ) ),
                                [@yAxisCategory], ASC
                            ),
                            [@yAxisCategory], DESC
                        ),
                        "@forInternalPurpose", [@clrSetter]
                    )
                )
            VAR _colorSelector =
                IF ( _rowValue = 1, _green, _red )
            RETURN
                "<path fill='" & _colorSelector & "' d='M"
                    & PATHITEM ( _segmentsFirstLine, [Value] ) & " "
                    & PATHITEM ( _segmentsSecondLine, _precountOfSegments - ( [Value] - 1 ) ) & "Z" & "' />",
            "",
            [Value], ASC
        ) & "</g>"
VAR _supportLines =
    "<g stroke='" & _grey & "' stroke-dasharray='5 5'>"
        & CONCATENATEX (
            _tblConnectionPoints,
            "<line x1='" & [@xCoordinates] & "' x2='" & [@xCoordinates] & "' y1='" & _paddingSpace & "' y2='" & _usableHeight - ( _paddingSpace * 0.2 ) & "'/>"
        ) & "</g>"
VAR _texts =
    VAR _lastIndexedYAxisPoint =
        INDEX ( 1, _tblConnectionPoints, ORDERBY ( [@yAxisCategory], DESC ) )
    VAR _yPositionsFirstLine =
        MAXX ( _lastIndexedYAxisPoint, [@yCoordinatesForFirstLine] )
    VAR _yPositionsSecondLine =
        MAXX ( _lastIndexedYAxisPoint, [@yCoordinatesForSecondLine] )
    VAR _xPosition =
        MAXX ( _lastIndexedYAxisPoint, [@xCoordinates] )
    RETURN
        "<g font-size='80%' font-family='Segoe UI' dominant-baseline='middle'>
<g text-anchor='start' font-weight='bold'>" & "<text fill='" & _firstLineColor & "' x='" & _xPosition + _paddingSpace - 5 & "' y='" & _yPositionsFirstLine & "'>" & _firstLineText & "</text>" & "<text fill='" & _secondLineColor & "' x='" & _xPosition + _paddingSpace - 5 & "' y='" & _yPositionsSecondLine & "'>" & _secondLineText & "</text>" & "</g>
<g text-anchor='middle' fill='" & _grey & "'>"
            & CONCATENATEX (
                _tblConnectionPoints,
                "<text x='" & [@xCoordinates] & "' y='" & _usableHeight + _paddingSpace - 5 & "'>" & [@yAxisCategory] & "</text>"
            ) & "</g>
</g>"
VAR _result = _svgDeclaration & _svgHeader & _supportLines & _texts & _segments & _line & _svgEnd
RETURN
    _result
Power BI Core Visuals supporting this template
Like most other SVGs that we want to dynamically generate, we can use them within three native visuals.
- Matrix
- New Card
- Table
The template is again aimed more at use within the new CARD visual, but with a bit of MACGyver work, it could also be used well in the other options mentioned. However, the maintenance would then be significantly higher.
Set up of new Card visual
- Visual
- Values: Off
- Layout
- Vertical alignment: Middle
- Cards
- Padding: Custom -> 0px (all)
- Image: On
- Image type: Image URL
- Image Url: fx
- Transparency: 0%
- Position: Bottom
- Padding: 0px
- Size: Auto
- General
- Size
- Width: 1100px
- Height: 405px
- Padding: 0px (all)
- Size


