

Light theory
Creating such a radar chart is a geometrical task. It is about creating the necessary axes, which are both circles, which should always be the same length apart, and line segments directed toward the shared center of the circles.
Of course, you must do more than just RANDOMLY determine in which direction the line segments will lead. You need to pre-count the number of segments into which we will divide the circle and then calculate the location of the points on the farthest circle accordingly. That’s how we get axes.
We then calculate the location of the points using the same equation and include the result.
Sometimes these graphs are created so that the “circular” expression of the axis is not in the form of a circle but simply the connection of the given points on the individual line segments to the center. However, I will only stick to the circular variant within this template.
DAX Template
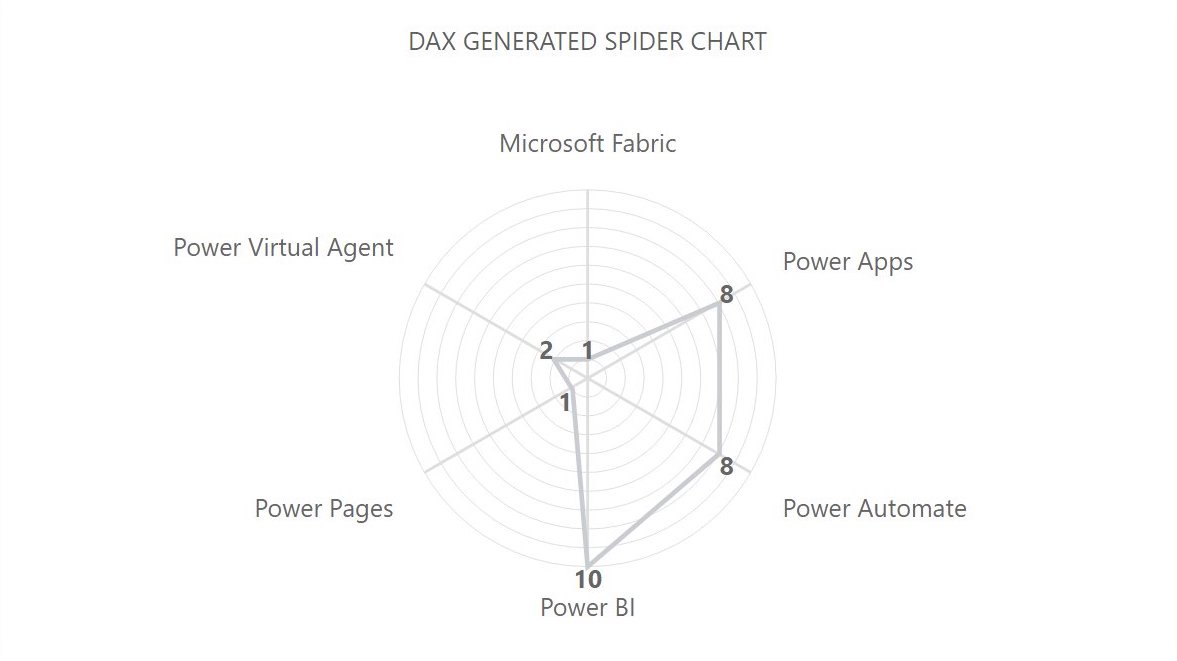
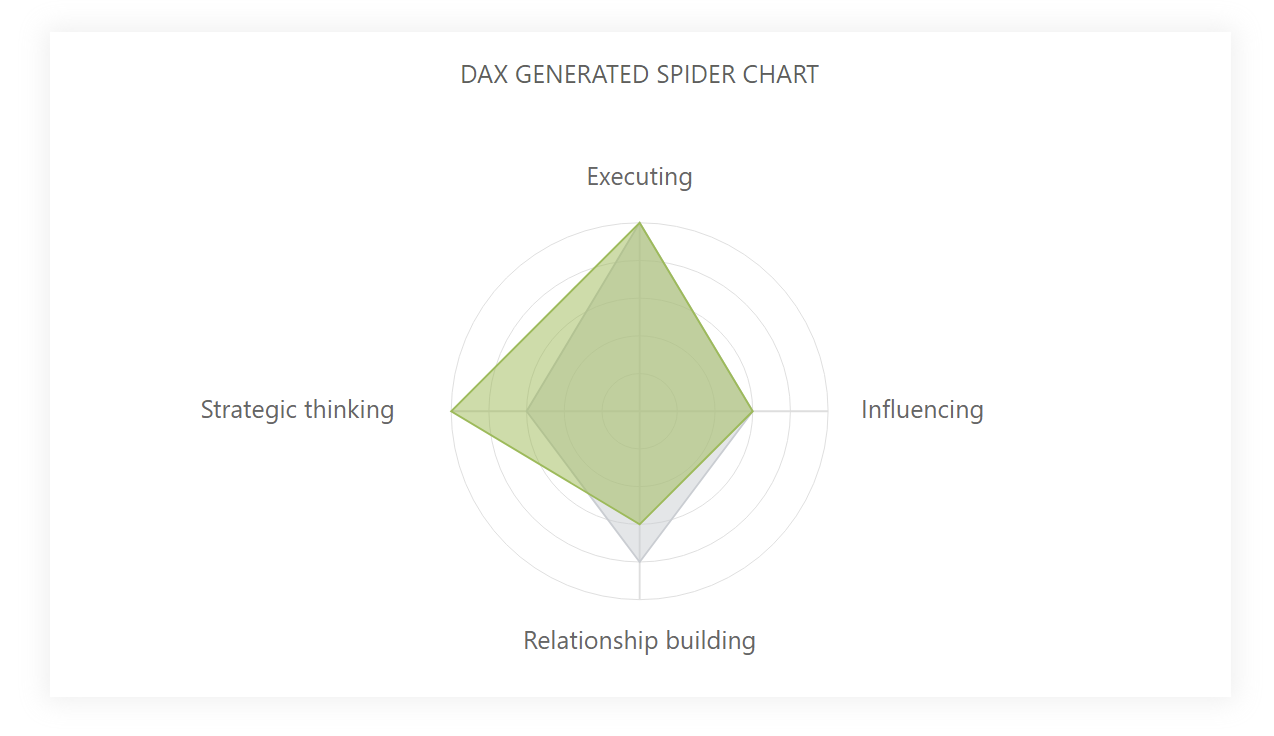
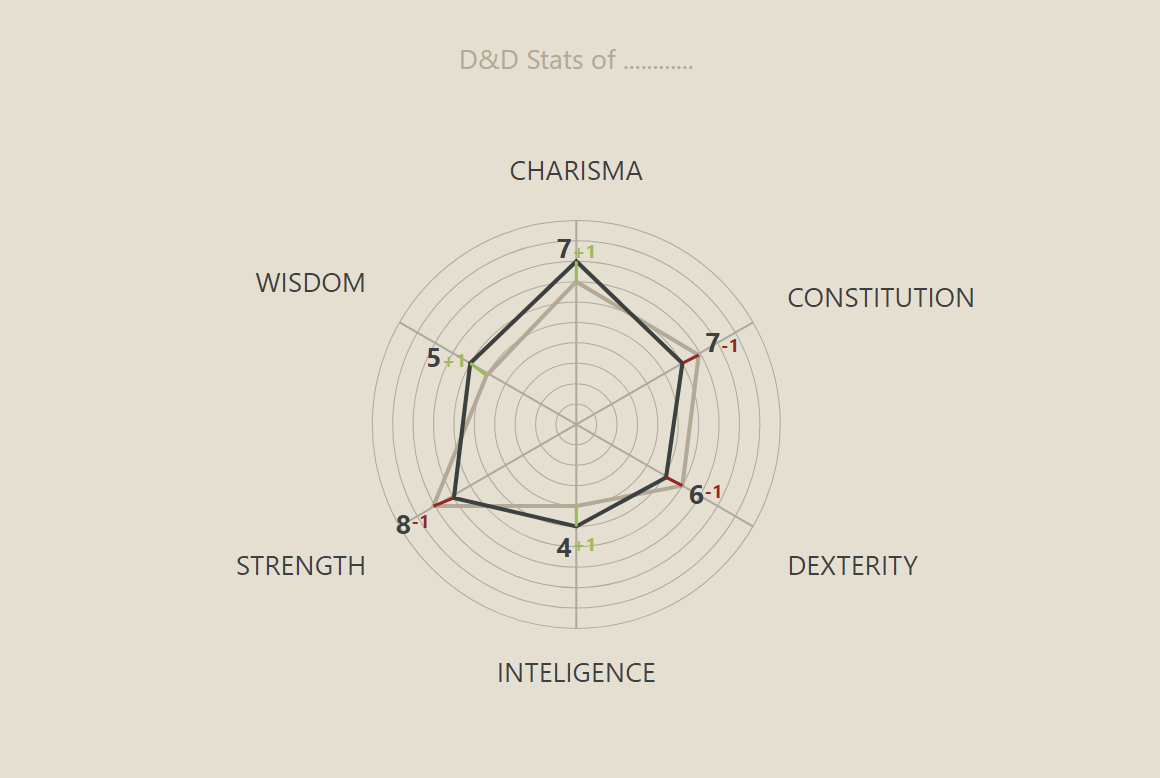
The template is written so you can fill in the values according to the labels without much difficulty. It can then be modified arbitrarily to return any result from the images you can find at the end of this article.
/* SETUP */
VAR _sizeInCard = DIVIDE(600,2.5) // Size of image setted in a the card (+ downscaled to 2.5)
VAR _numberOfCircles = 10 // Number of circles, that will be drawn
VAR _yUpModifier = 15 // Move the chart up, to center it in the card
VAR _rectangleModifier = 1.25 // Modification from a square to rectangle (x axis modification)
VAR _initialTbl = // ADD YOUR TABLE, CATEGORY COLUMN + MEASURE HERE
    ADDCOLUMNS(
        SELECTCOLUMNS(
        SUMMARIZE(
            <TABLE>, // TABLE
            <CATEGORY-COLUMN>),"@category",<CATEGORY-COLUMN>), // COLUMN
        "@score", <MEASURE> // MEASURE
    )

/* COLORS DECLARTIONS */

VAR _spiderWebColor = "#DEDEDE" // Color of the spiderweb (Circles + Lines)
VAR _polygonLineColor = "#C9CDD2" // Color of the polygon line (Polygon Line)
VAR _labelsColors = "#666666" // Color of the labes + data labels (Labels)

/* CALCULATIONS FOR SVG DECLARATION */
VAR _sizeOfSquare = _sizeInCard*0.8 // Main sizing for the viewbox
VAR _sizeModificator = 2 // Space modification between circles

/* SVG DECLARTIONS */
VAR _svgDeclaration = "data:image/svg+xml;utf8,"
VAR _svgHeader = "<svg xmlns='http://www.w3.org/2000/svg' x='0px' y='0px' viewBox='0 "&_yUpModifier&" "&_sizeOfSquare*_rectangleModifier&" "&_sizeOfSquare&"'>"
VAR _svgEnd = "</svg>"

/* CALCULATION */
VAR _preparedTbl =
    ADDCOLUMNS (
        _initialTbl,
        "@rowNum", ROWNUMBER (_initialTbl, ORDERBY ( [@score], ASC ) )
    )
VAR _categoryLines = COUNTROWS(_preparedTbl)
VAR _radius = _sizeOfSquare/2
VAR _angleMovement = ROUND(360/_categoryLines,1)
VAR _spaceBetweenCircles = ROUND(_radius/(_numberOfCircles*_sizeModificator),1)
VAR _endRadius = _spaceBetweenCircles*_numberOfCircles
VAR _rectangleRadius = _radius*_rectangleModifier
VAR _circleSeries = // Table for circles for the spiderweb
    ADDCOLUMNS(
        SELECTCOLUMNS(
            GENERATESERIES(1,_numberOfCircles,1),
            "@id",[Value]),
        "@radius",[@id]*_spaceBetweenCircles
    )
VAR _linesSeries = // Table for lines for the spiderweb
    ADDCOLUMNS(
        SELECTCOLUMNS(
            GENERATESERIES(0,_categoryLines-1, 1),
            "@id", [Value]),
        "@angles", [@id]*_angleMovement,
        "@x",
             VAR _angle = [@id]*_angleMovement
             RETURN
             IF(_angle<180,
                _endRadius*SIN(RADIANS(_angle))+_rectangleRadius,
                -_endRadius*SIN(RADIANS(_angle-180))+_rectangleRadius),
        "@y",
            VAR _angle = [@id]*_angleMovement
             RETURN
             IF(_angle<180,
                -_endRadius*COS(RADIANS(_angle))+_radius,
                _endRadius*COS(RADIANS(_angle-180))+_radius)
    )
VAR _lines = // Lines for the spiderweb
"<g stroke='"&_spiderWebColor&"' stroke-width='0.75'>"&
CONCATENATEX(_linesSeries,"<line x1='"&[@x]&"px' y1='"&[@y]&"px' x2='50%' y2='50%' />","")
&"</g>"

VAR _categoryDescriptions = // Spiderweb category descriptions
"<g font-family='Segoe UI' font-size='5pt'>"&
CONCATENATEX(
    _linesSeries,
    VAR _id = [@id]
    VAR _category = MAXX(FILTER(_preparedTbl,[@rownumber]=(_id+1)),[@category])
    VAR _textBaseline =
        SWITCH(
            TRUE(),
                [@angles]=0,"x='"&[@x]&"px' y='"&[@y]*0.8&"px' dominant-baseline='auto' text-anchor='middle'",
                [@angles]<90,"x='"&[@x]*1.05&"px' y='"&[@y]*0.95&"px' dominant-baseline='auto' text-anchor='start'",
                [@angles]=90,"x='"&[@x]*1.05&"px' y='"&[@y]&"px' dominant-baseline='middle' text-anchor='start'",
                [@angles]<180,"x='"&[@x]*1.05&"px' y='"&[@y]*1.05&"px' dominant-baseline='hanging' text-anchor='start'",
                [@angles]=180,"x='"&[@x]&"px' y='"&[@y]*1.05&"px' dominant-baseline='hanging' text-anchor='middle'",
                [@angles]<270,"x='"&[@x]*0.9&"px' y='"&[@y]*1.05&"px' dominant-baseline='hanging' text-anchor='end'",
                [@angles]=270,"x='"&[@x]*0.8&"px' y='"&[@y]&"px' dominant-baseline='middle' text-anchor='end'",
                "x='"&[@x]*0.9&"px' y='"&[@y]*0.9&"px' dominant-baseline='auto' text-anchor='end'"
                )
    RETURN
    "<text "&_textBaseline&" fill='"&_labelsColors&"'>"&_category&"</text>",""
    )
&"</g>"

VAR _circles =
"<g stroke='"&_spiderWebColor&"' stroke-width='0.25' fill='none'>"&
  CONCATENATEX(_circleSeries,"<circle cx='50%' cy='50%' r='"&[@radius]&"px'/> ","")
&"</g>"
VAR _scoreDefinition = // Precalculation of the score definition
    ADDCOLUMNS(
        ADDCOLUMNS(
        _preparedTbl,
        "@angle",
            VAR _rowNumber = [@rownumber]-1
            VAR _angle = _rowNumber*_angleMovement
            RETURN
            _angle),
        "@x",
            VAR _circleRadius = MAXX(FILTER(_circleSeries,[@id]=[@score]),[@radius])
            VAR _x =
                IF([@angle]<180,
                _circleRadius*SIN(RADIANS([@angle]))+_rectangleRadius,
                -_circleRadius*SIN(RADIANS([@angle]-180))+_rectangleRadius)
            RETURN
            ROUND(_x,0),
        "@y",
            VAR _circleRadius = MAXX(FILTER(_circleSeries,[@id]=[@score]),[@radius])
            VAR _y = IF([@angle]<180,
                -_circleRadius*COS(RADIANS([@angle]))+_radius,
                _circleRadius*COS(RADIANS([@angle]-180))+_radius)
            RETURN
            ROUND(_y,0)
    )
VAR _polygon = // Creating the polygon
"<g stroke='"&_polygonLineColor&"' stroke-width='1.25' fill='none'>
  <polygon points='"&CONCATENATEX(_scoreDefinition,[@x]&","&[@y]," ",[@rownumber])&"' />
</g>"
VAR _polygonDescription = // Creating the data labels for the polygon
"<g font-weight='bold' font-family='Segoe UI' font-size='5pt'>"&
CONCATENATEX(_scoreDefinition,
VAR _textBaseline = // Defining position of texts
    SWITCH(
        TRUE(),
            [@angle]=0,"x='"&[@x]&"px' y='"&[@y]*0.985&"px' dominant-baseline='baseline' text-anchor='middle'",
            [@angle]<90,"x='"&[@x]*1.01&"px' y='"&[@y]*0.99&"px' dominant-baseline='baseline' text-anchor='start'",
            [@angle]=90,"x='"&[@x]*1.01&"px' y='"&[@y]&"px' dominant-baseline='middle' text-anchor='start'",
            [@angle]<180,"x='"&[@x]*1.01&"px' y='"&[@y]*0.99&"px' dominant-baseline='hanging' text-anchor='start'",
            [@angle]=180,"x='"&[@x]&"px' y='"&[@y]*1.015&"px' dominant-baseline='hanging' text-anchor='middle'",
            [@angle]<270,"x='"&[@x]*0.99&"px' y='"&[@y]*1.01&"px' dominant-baseline='hanging' text-anchor='end'",
            [@angle]=270,"x='"&[@x]*0.985&"px' y='"&[@y]&"px' dominant-baseline='middle' text-anchor='end'",
            "x='"&[@x]*0.99&"px' y='"&[@y]*1.01&"px' dominant-baseline='baseline' text-anchor='end'"
            )
RETURN
"<text "&_textBaseline&" fill='"&_labelsColors&"'>"&
        [@score]&
    "</text>","")&"</g>"


VAR _result =
_svgDeclaration & _svgHeader & _categoryDescriptions & _lines & _circles & _polygon & _polygonDescription & _svgEnd
RETURN
_result
Power BI Core Visuals supporting this template
Like most other SVGs that we want to dynamically generate, we can use them within three native visuals.
- Matrix
- New Card
- Table
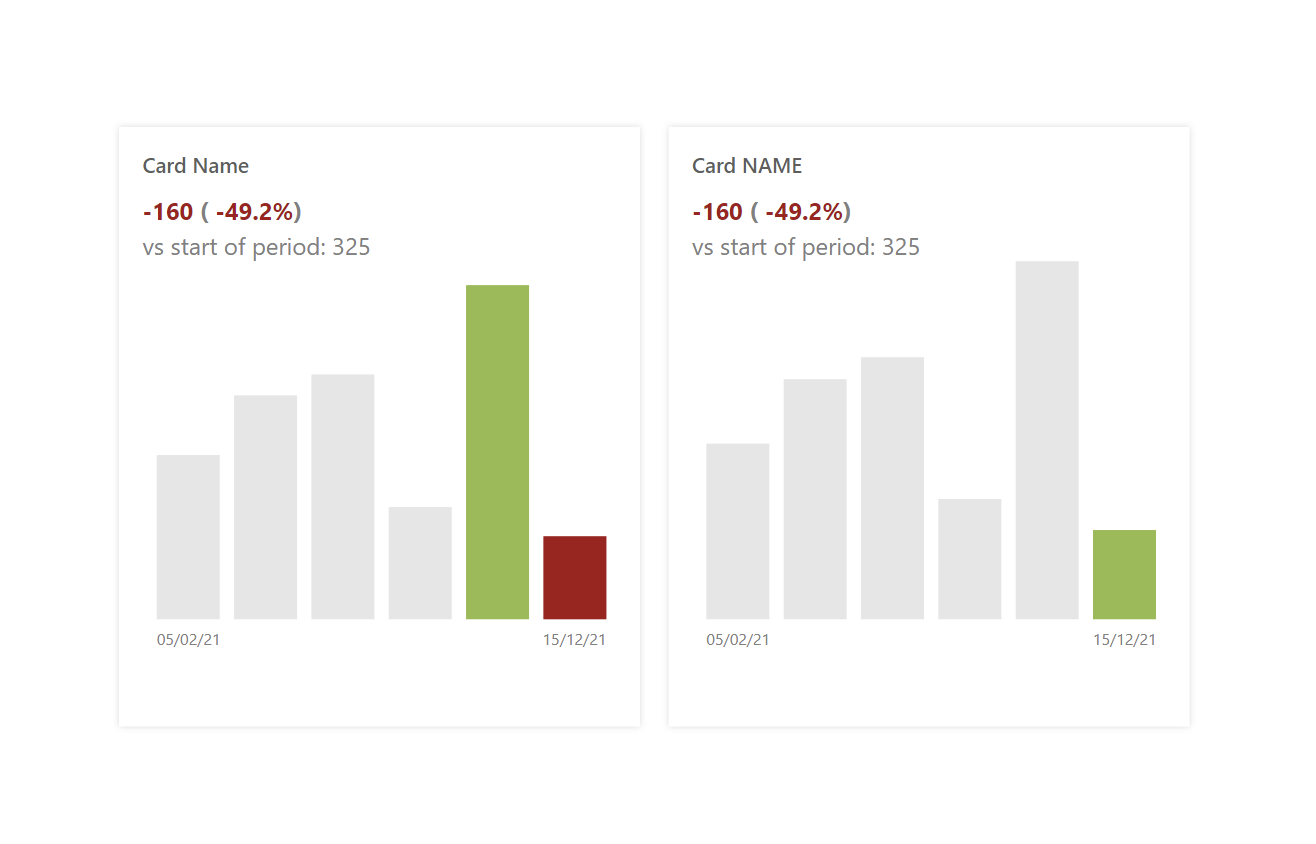
I prefer this template as part of the new Card visual because it requires a lot of space, so the probability of its use depending on the sub-categories transmitted using, for example, Matrix, is very low.
Set up of new Card visual
The new card visual contains several settings that are not entirely self-explanatory. I’m adding a chapter detailing how to set up this visual to get the best result from the template.
- Visual
- Values: On
- Horizontal alignment: Center
- Show blank as: “”
- Spacing: 0px
- Layout
- Vertical alignment: Middle
- Cards
- Padding: Custom -> 0px (all)
- Image: On
- Image type: Image URL
- Image Url: fx
- Transparency: 0%
- Position: Bottom
- Padding: 0px
- Size: 600px
- Values: On
- General
- Size
- Width: 752px
- Height: 424px
- Padding: 15px (all)
- Size
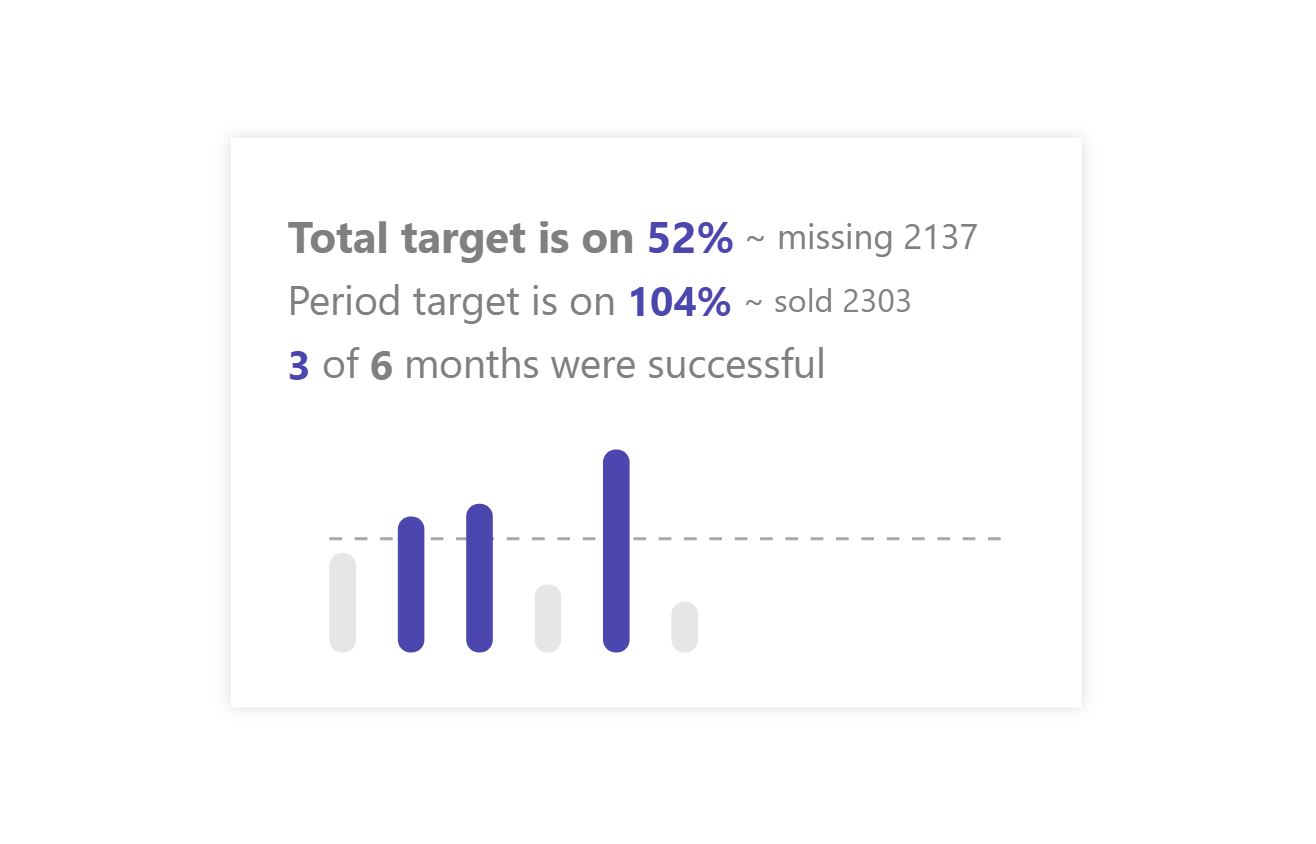
Possible uses
In general, I found the most use of this visual when I needed to visualize the results of some simple scale, which is quickly readable about the person and gives meaning to the user who comes to it. It is a visual not aimed at immediate understanding with answers but rather to support the analytical user.