


We go to data for answers, that we want to get them on a silver platter. However, one answer sometimes leads to other questions. Why not hand them over to the user at once so that he has everything they needs?
Since every element can be manually defined within SVG, you can give the answers to the users in any form and even use the ones that are otherwise unavailable in Power BI Core visuals. So there is no need to rely only on colors, which, moreover, are perceived differently by many people. You can also use bolding, rotation, repositioning, or other methods.
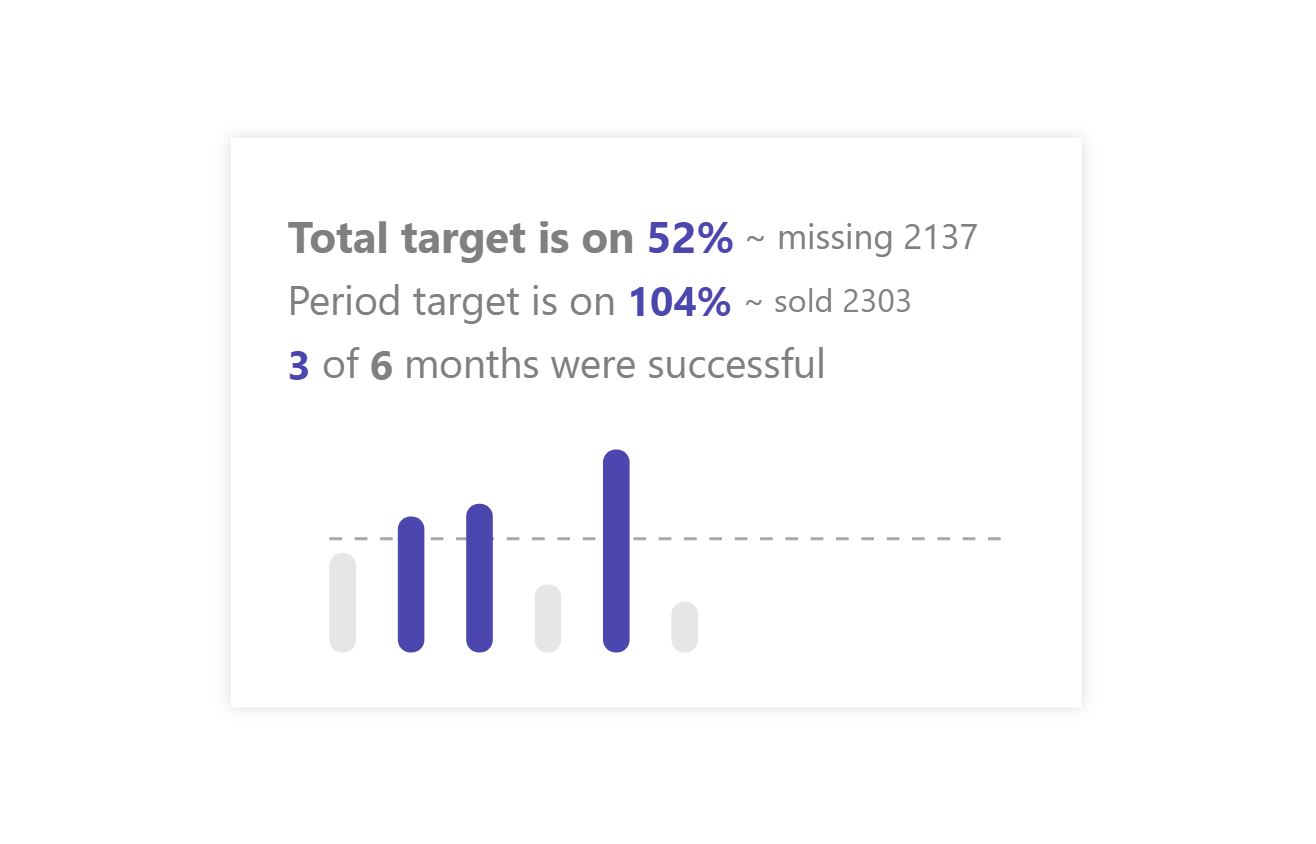
In the template of this card, I use some color play, but I also support it with different sizes of text and their boldness to draw attention to the appropriate place.
DAX Template
This template is fully extensible, so feel free to modify it however you like. But you can edit all the basic texts directly using variables.
/* SETUP */
VAR _spaceBetweenColumns = 5.5 // Space that will be reserved between columns
VAR _maxSizeOfColumn = 3.5 // Max size of column, if the calculated value is bigger than this, the column will be this size
VAR _columnRounding = 5 // Rounding of column corners
VAR _width = 300 // Width size of the SVG
VAR _height = 200 // Height size of the SVG
VAR _initialTbl = // ADD YOUR TABLE, PERIOD COLUMN (DATE, MONTH, QUARTER, YEAR,...) + MEASURE HERE
    ADDCOLUMNS (
        SELECTCOLUMNS(SUMMARIZE ( <TABLE>, <INSERT-YOUR-PERIOD-COLUMN> ), "@xAxisPeriod", <INSERT-YOUR-PERIOD-COLUMN> ),
        "@val", <MEASURE>
    )
VAR _target = <TARGET-MEASURE> // Target value or measure

/* TEXT DECLARTIONS */
VAR _firstLineInitialText = "Total target is on"
VAR _firstLineEndText =  "~ missing"
VAR _secondLineInitialText = "Period target is on"
VAR _secondLineEndText =  "~ sold"
VAR _thirdLineMiddleText = "of"
VAR _thirdLineEndText =  "months were successful"

/* COLORS DECLARTIONS */
VAR _grey = "#E6E6E6" // Will be used for all other columns
VAR _activePartsColor = "#4C47B4" // Will be used for all highly colored parts of card
VAR _darkGrey = "#808080" // Will be used for all text
VAR _targetLineColor = "#A8A8A8" // Will be used for target line

/* SVG DECLARTIONS */
VAR _svgDeclaration = "data:image/svg+xml;utf8,"
VAR _svgHeader = "<svg xmlns='http://www.w3.org/2000/svg' width='"&_width&"' height='"&_height&"'>"
VAR _svgEnd = "</svg>"

/* CSS DECLARATIONS */
VAR _style =
"<style>
    text{
        font-family:Segoe UI;
    }
    .columns{
         opacity: 1;
         outline: none;
    }
    .line{
        stroke:"&_targetLineColor&";
        stroke-width:1.25;
        stroke-dasharray:5 5;
    }
    .txtGroup{
        dominant-baseline: middle;
        text-anchor:start;
    }
    .bolder{
        font-weight: bold;
    }
</style>"

/* CALCULATION */
VAR _preparedTbl =
    ADDCOLUMNS (
        _initialTbl,
        "@rowNum", ROWNUMBER (_initialTbl, ORDERBY ( [@xAxisPeriod], ASC ) )
    )
VAR _maxValue =
    MAXX ( _preparedTbl, [@val] )
VAR _rowCounter =
    COUNTROWS ( _preparedTbl )
VAR _modifiedValue = _rowCounter*_target
VAR _resultSizeOfColumns =
    VAR _cal =
        ROUND ( DIVIDE ( 100 - ( ( _rowCounter + 1 ) * _spaceBetweenColumns ), _rowCounter ), 1 )
    RETURN
        IF ( _cal > _maxSizeOfColumn, _maxSizeOfColumn, _cal )
VAR _columns =
    CONCATENATEX (
        _preparedTbl,
        VAR _colorOfColumn =
            IF(_target<[@val],_activePartsColor,_grey) // Rules for coloring columns
        VAR _startOfColumn =
            ROUND ( DIVIDE ( [@val], _maxValue ) * 40, 1 )
        VAR _positionCounter = ( ( [@rowNum] - 1 ) * _resultSizeOfColumns ) + ( _spaceBetweenColumns * [@rowNum] )
        RETURN
            "<rect class='columns' x='" & _positionCounter & "%' y='" & 85-_startOfColumn & "%' width='" & _resultSizeOfColumns & "%' height='" & _startOfColumn & "%' fill='" & _colorOfColumn & "' rx='"&_columnRounding&"' />"
    )
VAR _targetLine =
    VAR _y = 85-ROUND ( DIVIDE ( _target, _maxValue ) * 40, 1 )
    RETURN
    "<line class='line' x1='"&_spaceBetweenColumns&"%' x2='"&100-_spaceBetweenColumns&"%' y1='"&_y&"%' y2='"&_y&"%' />"
VAR _initialText =
"<g class='txtGroup'>"&
    "<text y='4%' x='2.5%' font-size='107.5%' fill='"&_darkGrey&"'><tspan class='bolder'> "&_firstLineInitialText&" <tspan fill='"&_activePartsColor&"'>"
        &FORMAT(ROUND(DIVIDE(SUMX(_preparedTbl,[@val]),_modifiedValue),2),"0%")&
        "</tspan></tspan><tspan font-size='80%'> "&_firstLineEndText&" "&_modifiedValue-SUMX(_preparedTbl,[@val])&" </tspan>
    </text>"
    &
    "<text y='16.5%' x='2.5%' fill='"&_darkGrey&"'>
        "&_secondLineInitialText&" <tspan fill='"&_activePartsColor&"' class='bolder'>"
        &FORMAT(ROUND(DIVIDE(SUMX(_preparedTbl,[@val]),_modifiedValue),2),"0%")&
        "</tspan> <tspan font-size='80%'> "&_secondLineEndText&" "&SUMX(_preparedTbl,[@val])&" </tspan>
    </text>"
    &
    "<text y='29%' x='2.5%' fill='"&_darkGrey&"'>
        <tspan fill='"&_activePartsColor&"' class='bolder'>"
        & COUNTROWS(FILTER(_preparedTbl,[@val]>=_target)) &
        "</tspan> "&_thirdLineMiddleText&"
        <tspan class='bolder'>"
        & _rowCounter &
        "</tspan> "&_thirdLineEndText&"
    </text>
</g>"
VAR SVGImageURL = _svgDeclaration & _svgHeader & _style & _initialText & _targetLine &  _columns  & _svgEnd
RETURN
    SVGImageURL
Power BI Core Visuals supporting this template
Like most other SVGs that we want to dynamically generate, we can use them within three native visuals.
- Matrix
- New Card
- Table
Because this template requires the input of several different measures at once, it is mostly targeted to Card visual, where it fits in and easily draws attention to itself. But you must be careful that the Card contains only valid information or insights for the same KPI under investigation to avoid mixing different outputs.
So feel free to remove a line of text so that you don’t unnecessarily provide information that is not useful. Less is more.
Set up of new Card visual
- Visual
- Values: Off
- Layout
- Vertical alignment: Middle
- Cards
- Padding: Custom -> 15px (top, left, right) 0px (bottom)
- Image: On
- Image type: Image URL
- Image Url: fx
- Transparency: 0%
- Position: Bottom
- Padding: 0px
- Size: 300px
- General
- Size
- Width: 248px
- Height: 174px
- Padding: 5px (all)
- Size
Community contribution
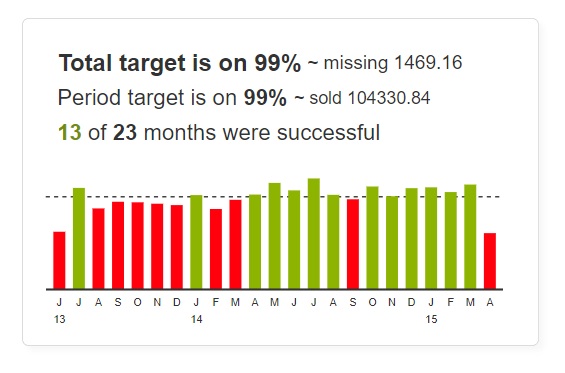
I am super happy that you have started to using my templates and also making them better. This one was improved by Adam Butt, who added some additional features to it. You can find his version below.
Get in touch with creator - Adam Butt: [LinkedIn](https://www.linkedin.com/in/adam-butt-09823333/) | [X (Twitter)](https://twitter.com/APB_Reports) | Gits
DATAMEERKAT_SVG_V3 =
VAR _width = 330
VAR _height = 200
VAR _columnRounding = 5
VAR _initialTbl =
ADDCOLUMNS (
SELECTCOLUMNS(SUMMARIZE ( 'Website Sales_Data', 'Website Sales_Data'[YearMonth] ), "@xAxisPeriod", 'Website Sales_Data'[YearMonth] ),
"@val", [SUM Gross Sales]
)
VAR _target = 4600
VAR _rowCounter = COUNTROWS ( _initialTbl )
VAR _dynamicSpaceBetweenColumns = DIVIDE(100, _rowCounter + 1)
VAR _dynamicMaxSizeOfColumn = DIVIDE(_width, _rowCounter * 1.5)
VAR _totalColumnSpacePercentage = 60
VAR _totalSpacePercentage = 40
VAR _individualColumnWidth = DIVIDE(_totalColumnSpacePercentage, _rowCounter)
VAR _individualSpacing = DIVIDE(_totalSpacePercentage, _rowCounter + 1)

VAR _firstLineInitialText = "Total target is on"
VAR _firstLineEndText =  "~ missing"
VAR _secondLineInitialText = "Period target is on"
VAR _secondLineEndText =  "~ sold"
VAR _thirdLineMiddleText = "of"
VAR _thirdLineEndText =  "months were successful"

VAR _grey = "#939393"
VAR _activePartsColor = "#323232"
VAR _darkGrey = "#323232"
VAR _targetLineColor = "#323232"
VAR _red = "#ff000c"
VAR _green = "#8cb400"
VAR _darkgreen = "#708E08"

VAR _svgDeclaration = "data:image/svg+xml;utf8,"
VAR _svgHeader = "<svg xmlns='http://www.w3.org/2000/svg' width='"&_width&"' height='"&_height&"'>"
VAR _svgEnd = "</svg>"

VAR _style =
"<style>
text{
font-family:Segoe UI;
}
.columns{
opacity: 1;
outline: none;
}
.line{
stroke:"&_targetLineColor&";
stroke-width:1;
stroke-dasharray:3 3;
}
.baseline{
stroke-linecap: round;
}
.txtGroup{
dominant-baseline: middle;
text-anchor:start;
}
.bolder{
font-weight: bold;
}
text {
font-family: Arial;
}
</style>"

VAR _preparedTbl =
ADDCOLUMNS (
_initialTbl,
"@rowNum", ROWNUMBER (_initialTbl, ORDERBY ( [@xAxisPeriod], ASC ) )
)
VAR _maxValue =
MAXX ( _preparedTbl, [@val] )

VAR _modifiedValue = _rowCounter*_target

VAR _resultSizeOfColumns =
VAR _cal =
ROUND ( DIVIDE ( 80 - ( ( _rowCounter + 1 ) * _dynamicSpaceBetweenColumns ), _rowCounter ), 1 )
RETURN
IF ( _cal > _dynamicMaxSizeOfColumn, _dynamicMaxSizeOfColumn, _cal )

VAR _columns =
CONCATENATEX (
_preparedTbl,
VAR _currentRowNum = [@rowNum]
VAR _currentVal = [@val]
VAR _colorOfColumn = IF( _currentVal >= _target, _green, _red )
VAR _startOfColumn = ROUND ( DIVIDE ( _currentVal, _maxValue ) * 40, 1 )
VAR _positionCounter = (_currentRowNum - 1) * (_individualColumnWidth + _individualSpacing) + _individualSpacing
RETURN
"<rect class='columns' x='" & _positionCounter & "%' y='" & 85-_startOfColumn & "%' width='" & _individualColumnWidth & "%' height='" & _startOfColumn & "%' fill='" & _colorOfColumn & "' rx='0' />"
)

VAR _targetLine =
VAR _y = 85-ROUND ( DIVIDE ( _target, _maxValue ) * 40, 1 )
RETURN
"<line class='line' x1='0%' x2='100%' y1='"&_y&"%' y2='"&_y&"%' />"

VAR _baseLine =
"<line class='baseline' x1='0%' x2='100%' y1='85%' y2='85%' stroke='"&_darkGrey&"' stroke-width='1.5' />"

VAR _initialText =
"<g class='txtGroup'>"&
"<text y='4%' x='2.5%' font-size='107.5%' fill='"&_darkGrey&"'><tspan class='bolder'> "&_firstLineInitialText&" <tspan fill='"&_activePartsColor&"'>"
&FORMAT(ROUND(DIVIDE(SUMX(_preparedTbl,[@val]),_modifiedValue),2),"0%")&
"</tspan></tspan><tspan font-size='80%'> "&_firstLineEndText&" "& ROUND(_modifiedValue-SUMX(_preparedTbl,[@val]),2)&" </tspan>
</text>"
&
"<text y='16.5%' x='2.5%' fill='"&_darkGrey&"'>
"&_secondLineInitialText&" <tspan fill='"&_activePartsColor&"' class='bolder'>"
&FORMAT(ROUND(DIVIDE(SUMX(_preparedTbl,[@val]),_modifiedValue),2),"0%")&
"</tspan> <tspan font-size='80%'> "&_secondLineEndText&" "&ROUND(SUMX(_preparedTbl,[@val]),2)&" </tspan>
</text>"
&
"<text y='29%' x='2.5%' fill='"&_darkGrey&"'>
<tspan fill='"&_darkgreen&"' class='bolder'>"
& COUNTROWS(FILTER(_preparedTbl,[@val]>=_target)) &
"</tspan> "&_thirdLineMiddleText&"
<tspan class='bolder'>"
& _rowCounter &
"</tspan> "&_thirdLineEndText&"
</text>
</g>"

VAR _minFontSize = 8
VAR _maxFontSize = 10

VAR _calculatedFontSize = ROUND(2.5 * _individualColumnWidth, 2)
VAR _adjustedFontSize =
MIN(
_maxFontSize,
MAX(
_calculatedFontSize,
_minFontSize
)
)
VAR _dynamicFontSize = _adjustedFontSize & "px"

VAR _monthNumbers =
CONCATENATEX (
_preparedTbl,
VAR _currentRowNum = [@rowNum]
VAR _positionCounter = (_currentRowNum - 1) * (_individualColumnWidth + _individualSpacing) + _individualSpacing + _individualColumnWidth/2
VAR _currentMonthName = FORMAT(DATEVALUE(LEFT([@xAxisPeriod], 4) & "-" & RIGHT([@xAxisPeriod], 2) & "-01"), "MMM")
VAR _currentMonthFirstLetter = LEFT(_currentMonthName, 1)
RETURN
"<text y='91%' x='" & _positionCounter & "%' fill='"&_darkGrey&"' text-anchor='middle' font-size='" & _dynamicFontSize & "'>" & _currentMonthFirstLetter & "</text>"

)

VAR _yearTexts =
CONCATENATEX (
_preparedTbl,
VAR _currentRowNum = [@rowNum]
VAR _positionCounter = (_currentRowNum - 1) * (_individualColumnWidth + _individualSpacing) + _individualSpacing + _individualColumnWidth/2
VAR _year = YEAR([@xAxisPeriod])
VAR _smallestMonthInYear = MINX(FILTER(_preparedTbl, YEAR([@xAxisPeriod]) = _year), [@xAxisPeriod])
VAR _year2Digit = RIGHT(_year, 2)
RETURN
IF (
[@xAxisPeriod] = _smallestMonthInYear,
"<text y='97%' x='" & _positionCounter & "%' fill='"&_darkGrey&"' text-anchor='middle' font-size='" & _dynamicFontSize & "'>" & _year2Digit & "</text>",
""
)
)

VAR SVGImageURL = _svgDeclaration & _svgHeader & _style & _initialText & _targetLine &  _columns  & _baseLine & _monthNumbers & _yearTexts & _svgEnd
RETURN
SVGImageURL