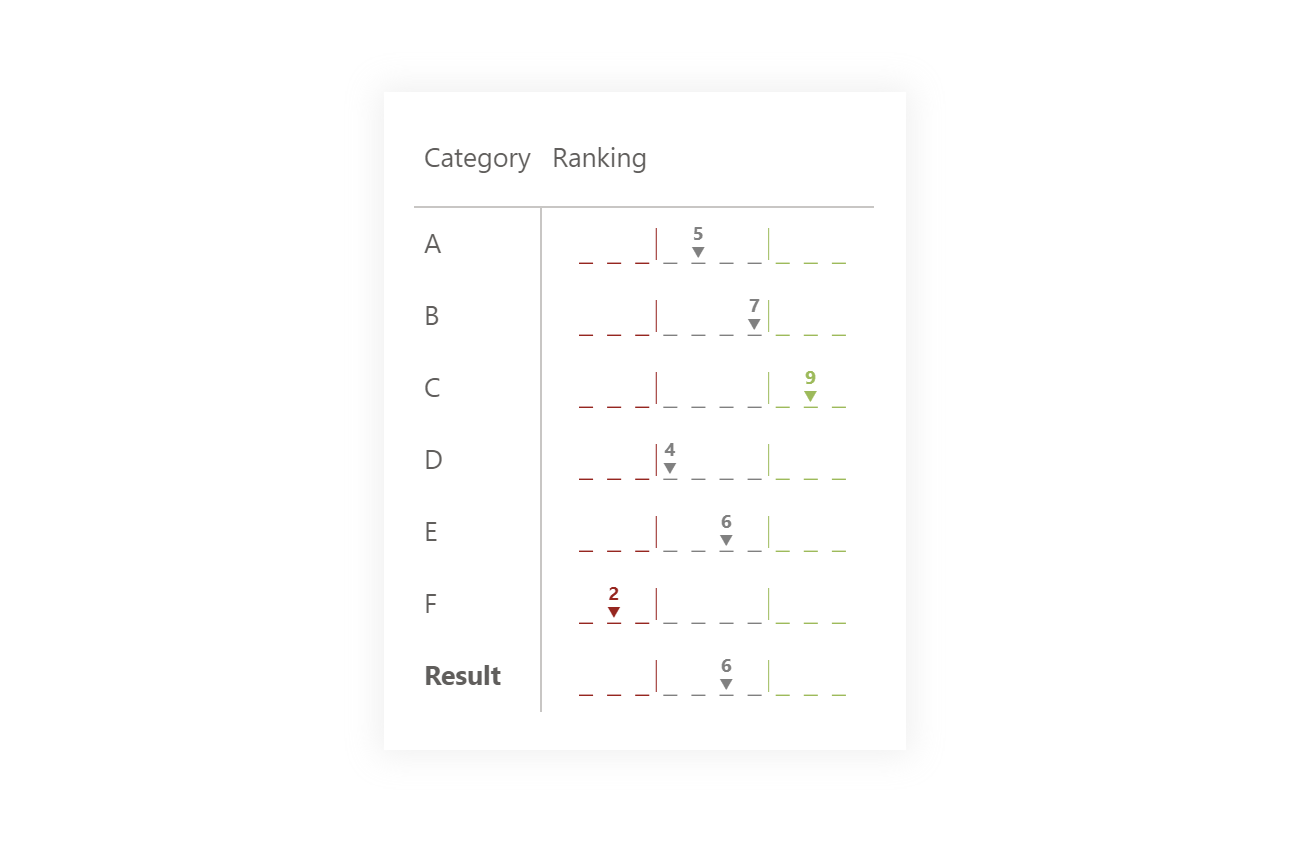


When I wrote the article SVG options in Matrix, I started to discover different possibilities for creating SVG and making charts within them. There are two main approaches to grasping this work.
- Create an image in another tool, then modify the created SVG code using DAX and extend it with calculations.
- Start creating a “picture” from the beginning and assemble it from simple objects.
In the end, it paid off the most for me to go with route number two, mainly because with most systems, I had a big problem recognizing how precisely the positioning of objects in space is resolved and how to generate the same within DAX.
Where to get information about SVG objects and attributes? I use these resources:
- https://www.w3.org/TR/SVG/
- https://www.w3schools.com/graphics/svg_intro.asp
- https://developer.mozilla.org/docs/Web/SVG
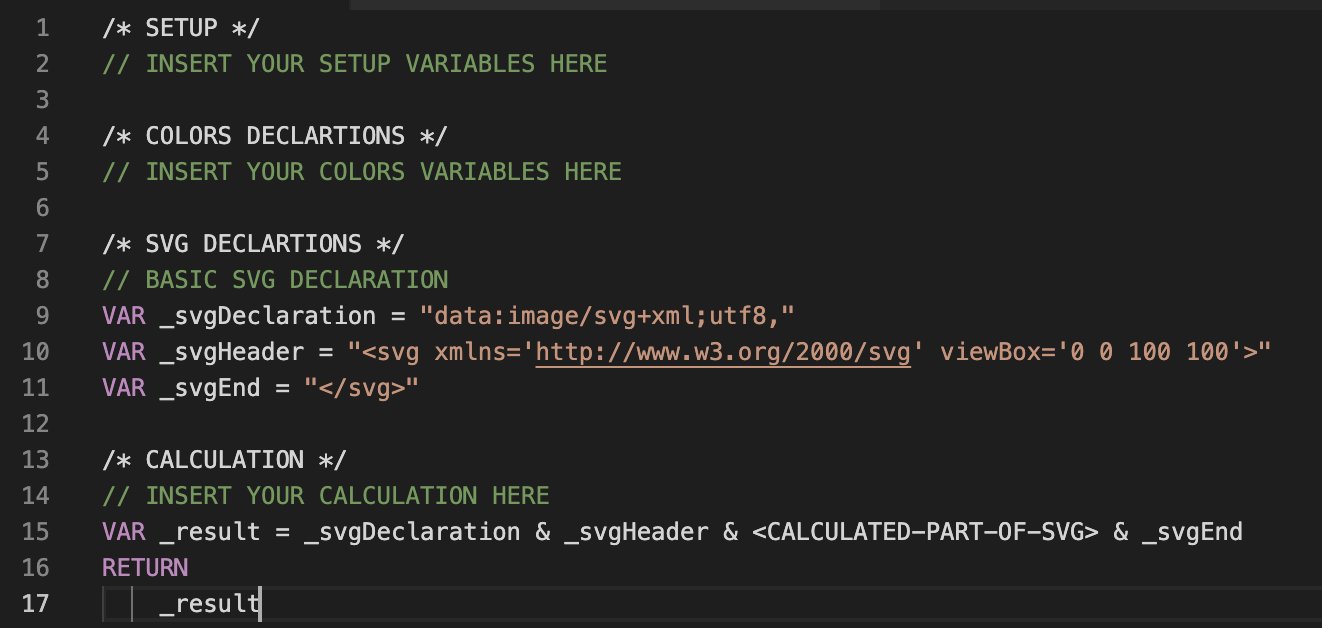
For easier development, I prepared this template, which you might also find useful:
/* SETUP */
// INSERT YOUR SETUP VARIABLES HERE

/* COLORS DECLARTIONS */
// INSERT YOUR COLORS VARIABLES HERE

/* SVG DECLARTIONS */
// BASIC SVG DECLARATION
VAR _svgDeclaration = "data:image/svg+xml;utf8,"
VAR _svgHeader = "<svg xmlns='http://www.w3.org/2000/svg' viewBox='0 0 100 100'>"
VAR _svgEnd = "</svg>"

/* CALCULATION */
// INSERT YOUR CALCULATION HERE
VAR _result = _svgDeclaration & _svgHeader & <CALCULATED-PART-OF-SVG> & _svgEnd
RETURN
    _result