

Writing into a vault is the easy part. Reading it out is where the money goes, and it does not scale the way writing does. A write is a write. A read pulls in discovery, greps, retries, and whatever ends up in the context window, and one bad question can cost a hundred times as much as a good one. Here are the six channels I actually shipped, what each of them costs, and why the requirement that decided the whole thing turned out not to be the one I kept talking about.
Where this picks up
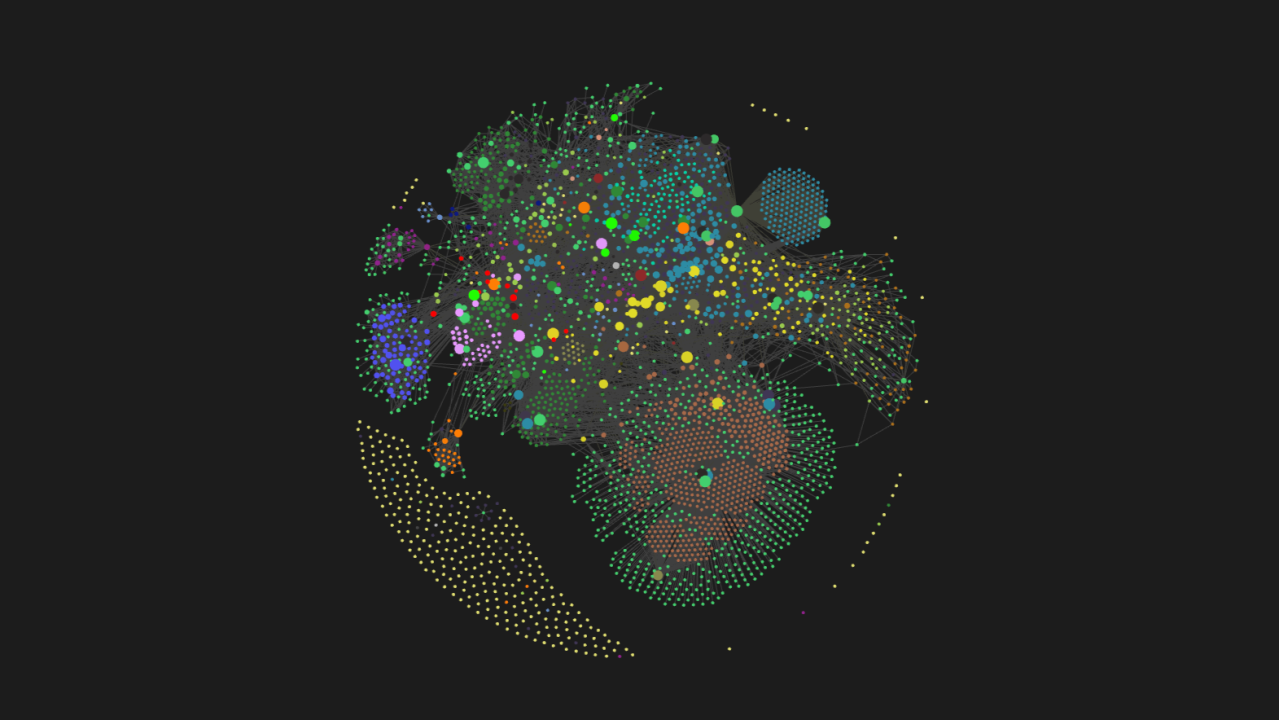
Last time I wrote about building my “AI Brain” in Obsidian and then tearing it down. Bad metadata, distant nodes, a graph shaped like a snowflake schema, and Claude finding its own way to an answer every single time.
I fixed the structure. Then I spent the next few months on the other half of the problem, which nobody posts about, because it does not screenshot well.
The system is called VIKI. It is not an AI OS. It is a backend, a pile of scheduled jobs, an agent, and a Telegram bot, all reading the same 3,137 notes. That number comes from the system’s own health audit this morning, not from me counting.
One scoping note. If your vault is 200 notes and you are the only one reading it, grep is fine and you can skip this. Everything below starts to matter when a machine reads your vault more often than you do.
A month of green checkmarks
Here is what “it works” looked like in my system.
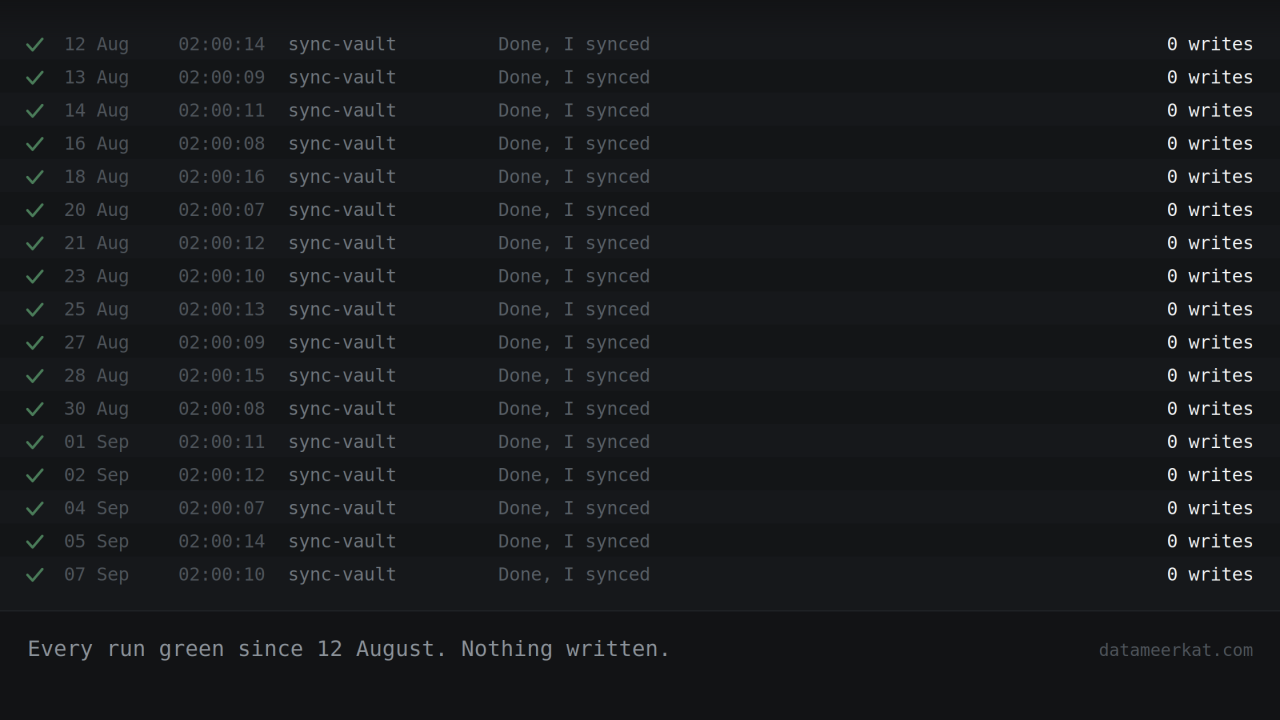
One of my scheduled jobs reported “Done, I synced” after every run. It wrote nothing. Not once.
The read channel it depended on had been dead since 12th of August. I am writing this on 7th of September. Every run in between came back green, because I never told the job what it was supposed to produce, so producing nothing counted as success.
And this is the part I keep coming back to: that job would have demoed beautifully. Green run, confident summary, no errors, no warnings. Nothing wrong with it could be seen from the outside, and the outside is the only place a demo is ever watched from.
Everyone shows you the writing half
Maybe it is still just my bubble, but the feed has not changed:
Drop everything into Obsidian so Claude can use it.
I want to be careful here because I have never seen anyone else’s prompts, and I am not going to say their system does not work. That is not my point.
My point is that the demo cannot tell either of us. A demo and a thing running unattended at 02:00 are two different objects, and video has no way to show which one you are looking at. My empty sync would have passed. It would have passed every day for a month.
Can you get a PoC out of Claude or Codex in an afternoon? Yes, easily. Everything after that afternoon is the part nobody films.
Six ways to read a vault
These are the six I shipped. Not the only six that exist, and not six points on one line. There are two questions crossed here: what carries the answer (MCP, HTTP, plain files) and what shape the answer arrives in (text search, typed query, prebuilt index).
- MCP over the Obsidian plugin. The one you find in every thread. Live search index, document map, backlinks, runtime commands, the lot. All of it inside a running desktop app, which is the catch. Obsidian has to be open, so from Cowork that means starting Obsidian first, every time, and remembering that you did.
- The Local REST API, raw. Genuinely fast, tens of milliseconds. /search/simple/ runs Obsidian’s fuzzy search and gives you a ranked, truncated list with context. Perfect for “find me the note about X”. Useless for “how many”.
-
The same API with a JsonLogic filter. The upgrade most people never find. Send application/vnd.olrapi.jsonlogic+json to the same /search/ route, and the body becomes a predicate over frontmatter instead of a search string. Mine mostly look like {“==”: [{“var”: “frontmatter.dwh_id”}, “
"]} with a glob wrapped around it to stay inside one folder. - Headless, straight at the files. Runs at 02:00 with the app shut. No search index, because the index lives in the app. In the plugin era, this was an obsidian-cli binary. Now it is the agent’s own file tools pointed at the folder.
- A typed index in my backend, reading disk directly. One pass over every note’s frontmatter, refreshed by mtime, invalidated on write. Builds in about a second, gets paid once per change instead of once per question, and every backlink in the vault comes along for another 0.02 s.
- An MCP tool hosted by that backend, over that index. The agent gets the MCP shape it likes, the answer comes from the index, and because the backend is already up there is no process to spawn per query. One call replaces three to seven greps.
Notice that 2 and 3 are the same surface asked two different ways, and 5 and 6 are the same structure reached over two different transports. That is going to matter at the end.
The lies
Three of the six lied to me. One of them fixed a lie the others were telling.
Channel one lied by succeeding. My jobs run with a strict MCP config, and ten of my thirteen sub-agents had nothing but mcp__obsidian__* in their tool list. When that server is not reachable, those names resolve to nothing, and the agent spawns with an empty toolbox instead of an error. 132 refusals across 44 logs. One job produced an empty result in 52 of 55 runs. Only two of seventeen jobs declared they were supposed to write anything at all, so zero writes stayed green everywhere else.
Improvising blind is not free either. One weekly job hit five missing skills and worked around them with about fifty shell calls. Five dollars a run, forty-three dollars over eight runs before I noticed.
Channel two lied by ranking. I pointed it at 500 client notes and asked for a total. What came back was the top of a ranking. I ran the same aggregation twice and got two different incomplete top-fives, with nothing in either response saying “partial”. A truncated ranking that does not announce itself looks exactly like a result set, so that is how I read it.
Channel five lied about the disk. Or rather, it lied three ways, and I only get told about one of them. My app is ad hoc signed, which means every rebuild is a new identity to macOS TCC, so whatever folder permissions I granted in the previous build are not the ones it looks up. That at least throws a permission error the moment I try. The iCloud one does not throw anything because nothing is wrong:
- The file is reduced to metadata only.
- Reading the file triggers a download.
- Based on your internet connection, the download can take about 20 seconds.
- Reading will succeed with exactly the right bytes.
That is slow enough to break everything sitting above it and correct enough that nothing anywhere writes a log line about it.
Most of that you can take away. Right-click the vault folder, set Keep Downloaded, and the files stop getting evicted. I have it on, and I would do it again. It is a setting, though, not a guarantee. Folders I add later do not inherit it, and the system will still evict when it decides it wants the space back. So the probe stays.
The third one is a syscall that keeps getting interrupted. It never raises anything either, because PEP 475 has Python retry it on my behalf, which is the right behavior almost every time. On a read that does not complete, the thread does not error out or return.
Channel three was the one that removed a problem instead of adding one. My HR sync used to take a source record, rebuild the note’s slug from it, and go looking for that filename. Every note I had moved or renamed came back as “does not exist”, so the sync made a second one. Now it resolves by GUID, and I get an answer I can branch on. One hit means use that path. Nothing means the record really is new. Two or more means something upstream is broken, so the row gets skipped and logged instead of guessed at. What I do not get is speed, because the predicate still runs against every note in scope.
Channels four and six have not lied yet. Channel four is also one I never benchmarked, and by now I have noticed those two facts keep turning up together.
What each read costs
Every number here is from my own vault. None of them are the same operation, which is the whole point.
| What is being read | Channel | Measured |
|---|---|---|
| keyword search across the vault | REST API, raw | 20 to 50 ms |
| tag filter | REST API, raw | 8 to 17 ms |
| search across the backend index | disk index | 166 ms warm, 364 ms cold |
| build the typed index | disk index | 1.03 s, once per change |
| add every backlink to that build | disk index | plus 0.02 s |
| four dashboard panels | disk index | 0.40 s to 0.05 s, 2,333 reads to 15 |
| render one Obsidian Base view | disk index vs its own walk | 0.21 s to 0.10 s |
| one question, model discovering by grep | agent read | up to 287 s, 7 greps and 2 globs |
| the same question with a generated vault map | agent read | 38.1 s to 20.3 s, 7 calls to 2 |
| scoped backend answer vs full agent answer | backend vs agent | 28.5 s vs 29.8 s |
Measured statistics
The warm and cold figures come from the probe my system runs on itself daily. I measured the rest by hand, and the difference showed up the moment the probe was inserted: my hand measurement of that row read 50 ms warm and 210 ms cold. The probe says 166 and 364. I am publishing the probe’s numbers.
Three channels are intentionally omitted from that table. MCP call overhead, the JsonLogic query, and a headless read never got a clean benchmark, so I have no number to give you. The channels I made faster were the ones I had instrumented. The one that died on me was the one I never measured.
That last row, 28.5 against 29.8, is one pair of runs four percent apart, which is noise. It stays in because the null result is the point.
So how do you actually pick one?
The table above cannot help you. Everything on the retrieval side finishes before a person notices, so speed doesn’t decide anything. Three questions decide it, in this order:
- Does it work with the app closed? My jobs run at 02:00. If not, the channel is out for anything scheduled, however good it is otherwise.
- Can it answer “how many”? Not “find me something about X”. An actual count over the whole population, the same number twice in a row.
- Can the exclusion live inside it? … is the code doing the reading mine, so the deny rule can sit in the search function itself.
Run the six through that, and it gets much less interesting than the six sections above:
| Channel | App closed | Answers “how many” | Exclusion can live inside |
|---|---|---|---|
|
No | Partly | No |
|
No | No | No |
|
No | Yes | No |
|
Yes | Only by grepping | Only while the CLI reads |
|
Yes | Yes | Yes |
|
Yes | Yes | Yes |
Decision matrix
Question one alone kills half the list. Question two kills the channel everybody starts with. Question three does not remove anything new, and that is the interesting bit, which I will get to in a second.
Ok, and before anyone tells me I picked the answer first and reverse-engineered the questions: partly, yes. I did not have this list when I started. I wrote it after the fourth time I picked the wrong one.
What if I did not need to hide anything from AI?
Last time I wrote that privacy was another layer, and that some folders in my vault must never be read by AI at all. Finances, mainly. Not “summarise it carefully”. Not read, not summarised, not quoted, by anything, ever.
So let me take that requirement away and see what actually changes.
The channel does not change. I still end up on the backend index, because 02:00 is still true and “how many” is still true, and neither has anything to do with privacy. This genuinely surprised me. I had been telling myself for months that privacy drove the rebuild.
What changes is how much of it has to be mine:
- The filter no longer has to be part of the search function. Right now, my candidate pre-selection pastes snippets into the prompt before there is a tool call for any permission layer to deny, and the MCP tool I host runs inside my own process where the CLI’s rules cannot see it. Without the requirement, none of that ordering matters.
- Channel three survives. If the model can read anything, running on somebody else’s API is fine, and JsonLogic over the plugin is a good answer for interactive work. I ripped it out because there is no plugin in my read path, and there is no plugin because I wanted the reading to be mine.
- Biggest one: I could have installed something. There are hosted retrieval layers and third-party MCP servers that do most of this. I did not write my own because theirs are slow. I wrote my own because I cannot put a deny rule inside code I did not write.
And it costs me something I had not thought about. A note the model may not open is still an ordinary link target for every other note in the vault, so it keeps getting pointed at something it will then be refused access to. Wasted turns, mostly. But the refusal is also information. It confirms that the file is sitting there, which means I am keeping its contents private and publishing the fact that it exists.
So the honest split is this. The app-closed requirement picked the channel. The privacy requirement decided I had to build it instead of installing it. Two different costs, and I had them filed under one heading for months.
If you do not have a folder the model must never see, you are looking at a much smaller project than mine. Probably a weekend.
The failures that looked like successes
For a long time, a map note in my vault root was holding 213 edges that belonged to my personal context note. The links were fine. They pointed to a real file that really existed, just not the one whose name was in the brackets, and since both files opened normally, the only way to find it was to go and count edges on a note nobody had any reason to count edges on.
Obsidian does not resolve links by first basename match. It prefers the file closest to the linking note and falls back to a longer path once a name is no longer unique. Any resolver you write outside the app has to copy those rules, or it will quietly disagree with the graph view, and only in the cases where two notes share a name, which is exactly where it matters. An old snapshot generator of mine left 5,155 links pointing to paths that no longer exist.
I only know about any of this because the reports are built to flag it about themselves. Without that, a retrieval layer marks its own homework, and it always passes.
So now it marks its own homework, and is built to fail
There are seven checks, once a day, written into the vault as notes I trip over:
- vault health,
- response speed,
- tag health,
- job health,
- addon health,
- data integrity,
- response quality.
Each of them scores itself, lists what it found, fixes what it may fix unsupervised, and leaves the rest as a checklist I either work through myself or hand back to the agent.
Every system marks its own homework. What I changed is that these are set up so losing points is normal, and a clean sheet means I should go and check the check.
This morning, the response speed one failed. p95 (95th percentile) on ask had increased from 392 ms to 12.49 seconds since the previous run, while p50 (50th percentile = median) had not changed, still 0.9 ms. So nothing got generally slower. A handful of questions got catastrophically slower, and everything else carried on, which is the kind of thing I used to find out about three weeks late.
Then I put that p50 next to my own cost table and got stuck. The table has a backend index search at 166 ms with the index warm, which is the cheapest retrieval operation in this article. The check says half of all ask calls come back inside a millisecond. Both numbers are mine, from the same system, and there is no arrangement in which both labels are accurate. Probably the p50 is counting cache hits and dispatch and calling them answers. It could also be that the probe does more work per call than a real ask does, in which case 166 ms is the wrong number.
I have not worked out which, and I am not dropping one of them to tidy this up. A number that reports itself on a schedule, in a formatted note, with a score attached, is still not the same as a number that is right. Mine does the first part now: seven areas, every morning.
The vault health check ran the same morning. Orphans at 38.2 percent. Five duplicate basenames still sitting at the end of bare wikilinks. That is rule five below, caught on the day it got worse.
Six rules I would hand to anyone starting this
- Every automated read must declare what it is supposed to produce. Otherwise green means nothing. First on the list because it is the one rule that would have caught the most expensive failure in this article.
- Rank on the backend, read in the model. The model gets candidates and single sections, never the corpus.
- Generate the vault map, never handwrite it, and schedule the refresh. Mine went stale for three weeks because the sync only ever ran on init. Four hundred tokens of the generated map reduced one benchmark question from 12 model turns to 6 and from 202,000 context tokens to 69,000.
- One typed parser. Four parsers are four truths.
- Never resolve a link by first basename match. Copy the app’s proximity rules, or demand explicit paths and reject the ambiguous ones.
- A field you add for retrieval does nothing until the ranker reads it, a query can express a range over it, and exactly one writer owns it. I am currently walking into this one with a last_update field on 3,000 notes that my ranker does not read yet.
So, was it worth it?
- Is the Local REST API plugin still installed? Yes, and optional. All it does now is light a green dot in my system’s indicator.
- Does anything call its MCP surface? No. Not once.
- Of the six ways, how many are in my read path? Three. Files on disk, the index in my backend, and the MCP tool over that index.
- Did I keep MCP? Yes. Channel six is MCP too, just served by something that cannot be closed by accident. I threw away the dependency on a GUI being open, not the protocol.
- Was the vault ever the bottleneck? No. How much I trusted my own layers was.
The audit that started all this found a data warehouse being scanned end-to-end for every question anyone asked of it, and most of what I have built since is the aggregate layer that should have been there from the beginning. Anyone who works with data has watched someone try to fix a full scan by speeding it up.
So how does your vault read itself? And if a read channel died in yours tonight, how long would it take you to find out?