


Recently, SVG images in the Matrix visual have come to the fore. First, it is necessary to explain why now, when it has been possible to use them this way for a long time. The main change that has occurred is that, in addition to the general size of the image, it is now possible to set the width and height separately within the Matrix. Doesn’t that seem like something extra? Let’s think about it from the perspective of the sparklines you may know from Excel. And yes! They have been in Power BI for some time too. Let’s face it, you can’t do much with them, and you can’t drive them very dynamically. But until recently, they had the advantage that their size was controlled by the column’s width and the row’s height. So they constantly adapt and are not bound by a specific size ratio.
But as I mentioned, that has changed! SVG charts give sparklines a new dimension because you can have everything under complete control. They can also be used for data storytelling because, at once, one cell of the Matrix can show much more information and even in a sequence.
 Showcase
Something like this can be helpful if we want to show the monthly/yearly change. But let’s try to make it ourselves!
Requirements
So we want to create an SVG image that will contain the following parts:
- Current value
- Percentage change between periods
- Bar chart symbolizing the current value in the context of the entire product
- A difference bar that displays the difference between the current value and the value from the previous period
We have a lot to do, so let’s get to it!
The model I will use for this is the same as in the other posts:
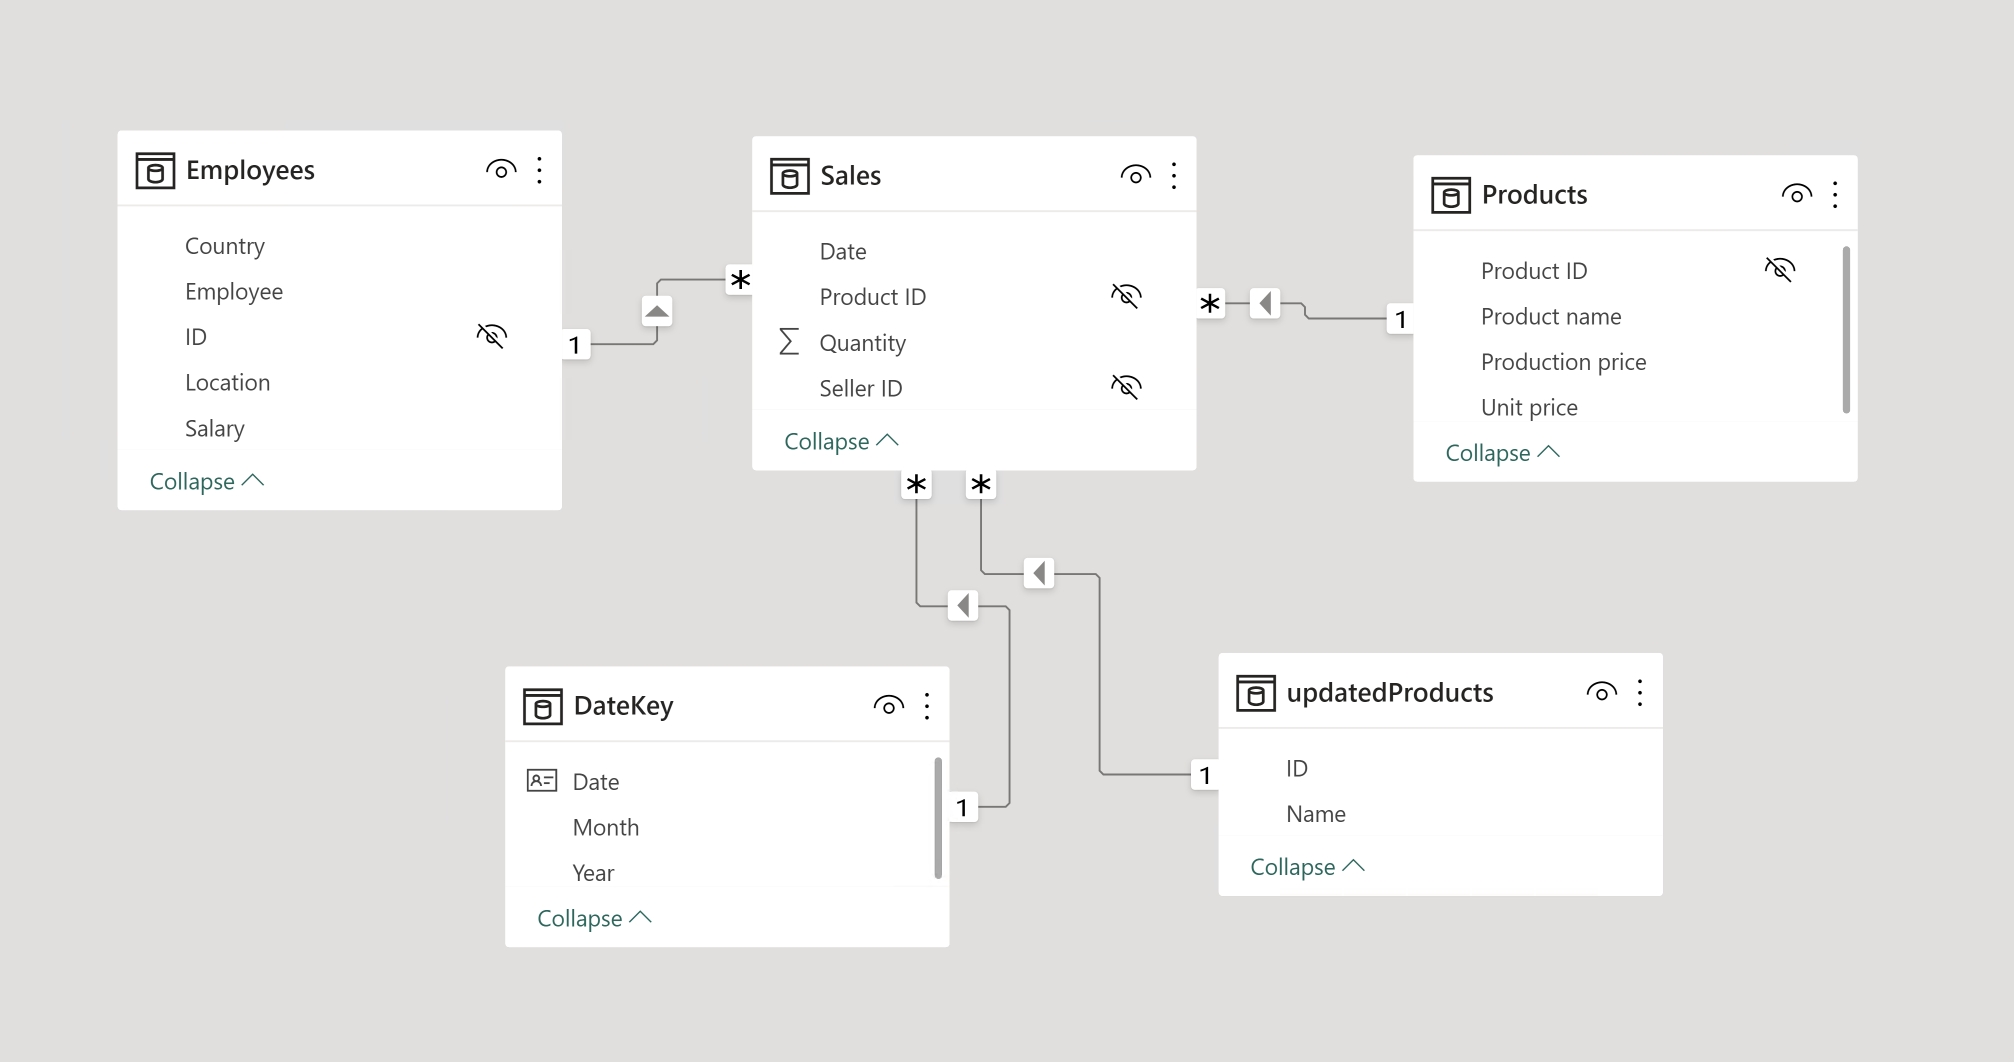 Model
Model
Let’s start step by step, specifically with a bit of theory…
SVG image in Matrix
The Matrix supports images, provided that we give it an expanded SVG file to an internal XML structure extended by one detail that defines that it is an image of the SVG type and what encoding was defined as part of its creation. Specifically, whether it is UTF-8 or Base64, we will be creating it in UTF-8 so that the necessary extension will look like this:
"data:image/svg+xml;utf8,"If we load a folder with an SVG file in Power Query and decompose it into an XML structure, we could also use it by adding this extension. We would place this before the beginning of the obtained XML structure. If you want to use an SVG file from your computer, you can do it using the Text.FromBinary() function and extending the previous string:
"data:image/svg+xml;utf8,"&Text.FromBinary([Content]) // [Content] is column with Binary value of SVGWhere the result in the preview after use will look like this:
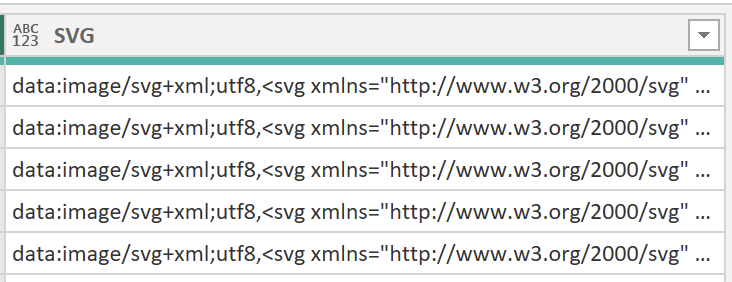 Exported SVG code with addon
The content prepared in this way can then be used very quickly in the Matrix because we can create a simple measure that gets the content of this column. Then, by connecting the settings within the Data Category to the Image URL, the image will be rendered.
Prepared measure:
MAX ( Svg[SVG] )
Data Category Settings:
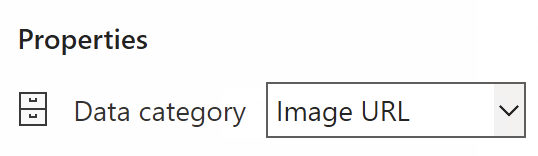 Data Category
Rendered SVG image from measure v matrix:
 SVG image in Matrix
Since the SVG images are divided into text inscriptions, we can, for example, modify them arbitrarily using the SUBSTITUTE() function. This is useful because we want several parts in the SVG image that will dynamically change their value, color, etc…
OR! As I already mentioned, we can create it from scratch.
Custom SVG with a current value
You can create your own SVG anywhere and in any editor… even a text editor. So, why not make it directly within the new Measure in DAX? For this, we will need some documentation explaining what properties we can use to create SVG and how to extend them afterward. One of the most basic documentation is this: W3 - SVG
At the beginning of the declaration, we only need an element marked “svg” within it. Then, we can use the attribute “xmlns” to define which SVG version we want to create. We will prepare SVG version 2, so we need the namespace “http://www.w3.org/2000/svg”.
So our starting point will be this structure:
<svg xmlns="http://www.w3.org/2000/svg"></svg>We can add the current value to it using the “text” element and use its “x” and “y” attributes to define its location in space. The “font-family” attribute defines the font used, “font-size” will help us define its size, “fill” color, and “font-weight” whether the text should be bold.
A large part of numerical attributes can also be specified as percentage values within SVG, so for example, “x” and “y” can be set to “25%,” and this means that element will be located at 25% of the width and 25% of the height of the SVG image. You need to understand that each object can behave differently, so you need to try it out and refer to the documentation. For example, this mentioned “text” element does not calculate the “x” and “y” coordinates from the upper left corner but from the lower left point of the text because the line on which the text is placed starts from this point. Therefore, manipulating the text and placing it precisely in the space can be more complicated.
So our first SVG image will look like this:
<svg xmlns="http://www.w3.org/2000/svg">
    <text x="25%" y="25%" font-family="Segoe UI" font-weight="bold" font-size="25%" fill="#A21515">
        15000
    </text>
</svg>
If I want to transfer this code to DAX to measure, I will have to modify it a little because those double quotes must be transferred to the resulting text as its part. Therefore, all quotes need to be expanded with additional quotes so that DAX recognizes them as one text and, of course, adds the declaration part:
firstSVG =
"data:image/svg+xml;utf8," & "<svg xmlns=""http://www.w3.org/2000/svg"">
    <text x=""25%"" y=""25%"" font-family=""Segoe UI"" font-weight=""bold"" font-size=""50%"" fill=""#A21515"">
        15000
    </text>
</svg>"
The result will be displayed in the Matrix after setting the Data Category as follows:
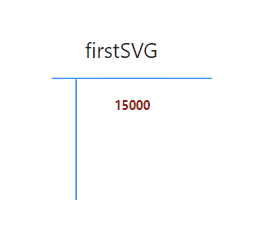 Created text SVG
We can start expanding it now. For example, switching from a 15000 value to our calculated one is calculated by a measure called [# Total Quantity].
SUM ( Sales[Quantity] )
We can also set a condition right away, for example, so that above a specific value, the color of the text changes to green. So the extended metric will look like this:
VAR _totalQ = [# Total Quantity]
VAR _color =
    """" & IF( _totalQ > 30000, "#34AC65", "#A21515" ) & """"
RETURN
    "data:image/svg+xml;utf8,"
        & "<svg xmlns=""http://www.w3.org/2000/svg"">
    <text x=""25%"" y=""25%"" font-family=""Segoe UI"" font-weight=""bold"" font-size=""50%"" fill="
        & _color
        & ">
        "
        & _totalQ
        & "
    </text>
</svg>"
The output in the expanded Matrix will look like this:
 Matrix with created SVG and Months
We have already created the text, and we managed to expand it with the first dynamic element. So let’s move on.
Extension by the percentage change
Let’s add another one to the already created text, which will calculate the percentage change between individual months. I’ll create it under a new metric. In addition to the existing “text,” I will use two new elements. Specifically “g” and “tspan.”
- “g” - indicates a group of elements that will behave as a whole and will share specific attributes
- “tspan” - indicates a fragment within the “text” element, which will be extended by other attributes but will also receive attributes from the parent and develop them further
VAR _actualValue = [# Total Quantity]
VAR _prevValue =
    CALCULATE(
        [# Total Quantity],
        OFFSET( -1, ALLSELECTED( DateKey[Year], DateKey[Month] ) )
    )
VAR _percChange =
    DIVIDE( _actualValue - _prevValue, _prevValue )
VAR _color =
    """" & IF( _actualValue > 30000, "#34AC65", "#A21515" )
        & """"
RETURN
    "data:image/svg+xml;utf8,"
        & "<svg xmlns=""http://www.w3.org/2000/svg"">
    <g font-family=""Segoe UI"">
    <text x=""25%"" y=""25%"" font-size=""50%"">
        <tspan font-weight=""bold"" fill="
        & _color
        & ">"
        & _actualValue
        & "</tspan> <tspan font-size=""65%"">"
        & "("
        & FORMAT( _percChange, "0.0%" )
        & ")"
        & "</tspan>
    </text>
    </g>
</svg>"
It must be mentioned that the “tspan” element that adjusts the font size to 65% does not adjust the size against the overall object but against the parent “text” element, which has already set the size to 50% just against the overall object. So our percentage change is 65% of 50% which is 32.5%. It is such a small thing that can be confusing for some. But, on the other hand, it makes perfect sense to degrade the font size gradually. This way, we know these texts will always be in the same size ratio. And at the same time, the “g” group indicates that all subordinate elements will use the same font family.
This modification has one small problem. That is, the result for the percentage change will show up at this time under all assumptions. So even if the data for the previous month is not available.
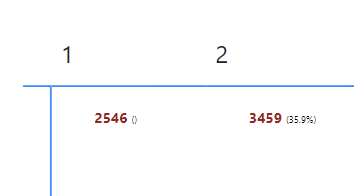 First month change Issue
But we can solve this very quickly, with the help of a relatively small change, which is to say that the font color will be “none.”
VAR _actualValue = [# Total Quantity]
VAR _prevValue =
    CALCULATE(
        [# Total Quantity],
        OFFSET( -1, ALLSELECTED( DateKey[Year], DateKey[Month] ) )
    )
VAR _percChange =
    DIVIDE( _actualValue - _prevValue, _prevValue )
VAR _precChangeShower =
    """" & IF( ISBLANK( _prevValue ), "none", "#E6E6E6" ) & """"
VAR _color =
    """" & IF( _actualValue > 30000, "#34AC65", "#A21515" )
        & """"
RETURN
    "data:image/svg+xml;utf8,"
        & "<svg xmlns=""http://www.w3.org/2000/svg"">
    <g font-family=""Segoe UI"">
    <text x=""25%"" y=""25%"" font-size=""50%"">
        <tspan font-weight=""bold"" fill="
        & _colors
        & ">"
        & _actualValue
        & "</tspan> <tspan font-size=""75%"" fill="
        & _precChangeShower
        & ">"
        & "("
        & FORMAT( _percChange, "0.0%" )
        & ")"
        & "</tspan>
    </text>
    </g>
</svg>"
This modification is already starting to return quite a reasonable result!
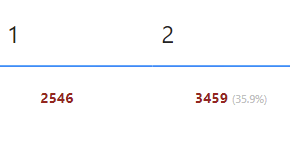 Fixed first month
Adding a basic bar chart
But the show doesn’t end there! We need to create a graph that will simulate a bar chart. And that is also very simple. We will use the “rect” element for this, which will allow us to draw a rectangle. You have to realize how such a bar chart should work. There are several possible approaches. One says that we will firmly define the maximum value to which individual bars will approach. We can do that, but we will not be 100% sure that we will hit the bar so that it makes sense or that there will not be a fluctuation in some months that would exceed this maximum value. So it makes more sense to go the other way! Which says that we will calculate all the current results in advance and choose the highest one from them. And then, we use that as the maximum value.
For that, this DAX function comes in handy!
VAR _allVaues =
ADDCOLUMNS (
ALLSELECTED ( DateKey[Year], DateKey[Month] ),
"@quantity", [# Total Quantity]
)
RETURN
MAXX ( _allVaues, [@quantity] )
This measure gives us the maximum value across all months in the current selection, and we can use it for our bars. As I already mentioned, we will use the “rect” element for the bars, and specifically, the following attributes will be helpful for it:
- y
- width
- height
- fill
We already know two of them, and two are still new. Like “x” and “y” for text, “width” and “height” can be set using percentage values. So width=100% will mean that the bar will have a width across the entire column. So if I look at it from the point of view of the problem, the resulting width of the bar, I have to get an answer to the question of what % is the current value of the maximum and then insert this result into the width.
VAR _grey = "#E6E6E6"
VAR _red = "#A21515"
VAR _green = "#34AC65"
VAR _actualValue = [# Total Quantity]
VAR _allVaues =
ADDCOLUMNS(
SUMMARIZE( DateKey, DateKey[Year], DateKey[Month] ),
"@quantity", [# Total Quantity]
)
VAR _prevValue =
CALCULATE(
[# Total Quantity],
OFFSET( -1, ALLSELECTED( DateKey[Year], DateKey[Month] ) )
)
VAR _percChange =
DIVIDE( _actualValue - _prevValue, _prevValue )
VAR _precChangeShower =
"""" & IF( ISBLANK( _prevValue ), "none", _grey ) & """"
VAR _color =
"""" & IF( _actualValue > 30000, _green, _red ) & """"
VAR _maxValue = [# Max Value in Months]
VAR _actualWidth = DIVIDE( _actualValue, _maxValue )
VAR _barColor =
"""" & IF( _actualValue > 0, _grey, _red ) & """"
RETURN
"data:image/svg+xml;utf8,"
& "<svg xmlns=""http://www.w3.org/2000/svg"">
<rect y=""50%"" width="""
& FORMAT( _actualWidth, "0.0%" )
& """ height=""30%"" fill="
& _barColor
& "></rect>
<g font-family=""Segoe UI"">
<text x=""25%"" y=""25%"" font-size=""50%"">
<tspan font-weight=""bold"" fill="
& _color
& ">"
& _actualValue
& "</tspan> <tspan font-size=""75%"" fill="
& _precChangeShower
& ">"
& "("
& FORMAT( _percChange, "0.0%" )
& ")"
& "</tspan>
</text>
</g>
</svg>"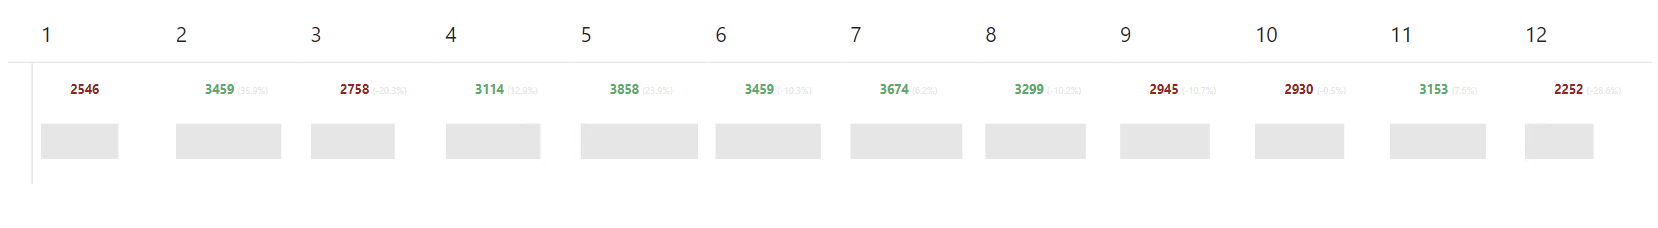 Bar Chart Addon
It works as it should! Moreover, the result is starting to look better and better. So let’s dive into the next edit!
Extension by difference bar
It’s nice that the bar chart works for us, but when we say that there has been some decrease or increase, it would be nice if it was also displayed in the bar chart. For example, if there is an increase, the increasing part will be marked in solid green, and the decreasing part will be marked only with an outline dashed line along the previous state, which will otherwise be completely transparent. (So fill = “none”)
But we will need more attributes that we haven’t used yet, which will help us a lot to surround that bar with a dashed frame.
- stroke
- stroke-width
- stroke-dasharray
These attributes are shared with, for example, the “line” and “path” elements.
VAR _grey = "#E6E6E6"
VAR _red = "#A21515"
VAR _green = "#34AC65"
VAR _none = """none"""
VAR _actualValue = [# Total Quantity]
VAR _allVaues =
    ADDCOLUMNS(
        SUMMARIZE( DateKey, DateKey[Year], DateKey[Month] ),
        "@quantity", [# Total Quantity]
    )
VAR _prevValue =
    CALCULATE(
        [# Total Quantity],
        OFFSET( -1, ALLSELECTED( DateKey[Year], DateKey[Month] ) )
    )
VAR _percChange =
    DIVIDE( _actualValue - _prevValue, _prevValue )
VAR _precChangeShower =
    """" & IF( ISBLANK( _prevValue ), "none", _grey ) & """"
VAR _color =
    """" & IF( _actualValue > 3000, _green, _red ) & """"
VAR _maxValue = [# Max Value in Months]
VAR _actualWidth = DIVIDE( _actualValue, _maxValue )
VAR _barColor =
    """" & IF( _actualValue > 0, _grey, _red ) & """"
VAR _prevValueStartCoordinate = DIVIDE( _prevValue, _maxValue )
VAR _difBarColor =
    SWITCH(
        TRUE( ),
        _percChange = 0, "none",
        _percChange > 0, _green,
        _red
    )
VAR _difBarCode =
    "x="""
        & SWITCH(
            TRUE( ),
            _percChange = 0, "0 "" fill=" & _none,
            _percChange > 0,
                FORMAT( _prevValueStartCoordinate, "0.0%" ) & """"
                    & " fill="
                    & """"
                    & _difBarColor
                    & """",
            FORMAT( _actualWidth, "0.0%" ) & """" & " fill=" & _none
                & "  stroke-width="
                & """1"""
                & " stroke="
                & """"
                & _difBarColor
                & """"
                & "   stroke-dasharray="
                & """4"""
        )
RETURN
    "data:image/svg+xml;utf8,"
        & "<svg xmlns=""http://www.w3.org/2000/svg"">
    <rect y=""50%"" width="""
        & FORMAT( _actualWidth, "0.0%" )
        & """ height=""30%"" fill="
        & _barColor
        & "></rect>
    <rect y=""50%"" width="""
        & FORMAT( ABS( _percChange ), "0.0%" )
        & """ height = ""30%"" "
        & _difBarCode
        & "></rect>
    <g font-family=""Segoe UI"">
    <text x=""25%"" y=""25%"" font-size=""50%"">
        <tspan font-weight=""bold"" fill="
        & _color
        & ">"
        & _actualValue
        & "</tspan> <tspan font-size=""75%"" fill="
        & _precChangeShower
        & ">"
        & "("
        & FORMAT( _percChange, "0.0%" )
        & ")"
        & "</tspan>
    </text>
    </g>
</svg>"
There are far more modifications in this code, and before I describe them, I’d like to show you how far we’ve come:
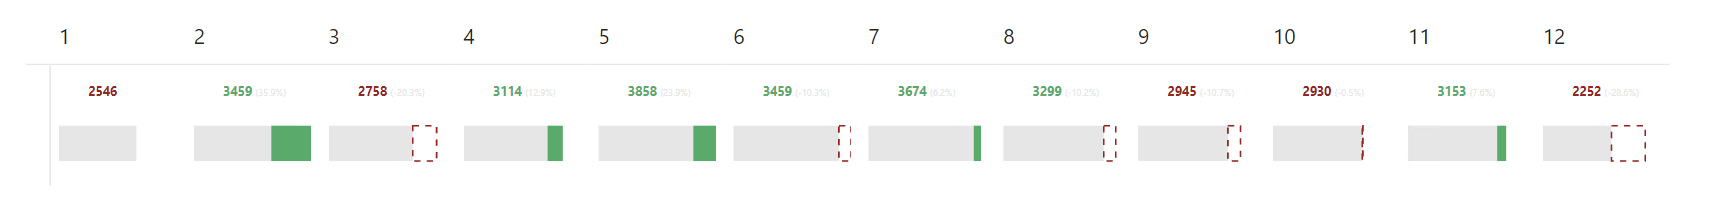 Second Bar added
First, it was necessary to use the already obtained difference compared to the previous month. This value helped us set the width of the new bar. Its positivity, in turn, helped us to determine whether it should be an increase or a decrease. And that helped us decide whether the new bar should be complete. In addition, according to that difference, one variable, “_difBarCode” was created here, which transfers most of the necessary code to the SVG definition.
We’re almost there! It remains to fine-tune when which text is colored and one ASCII character, but otherwise, we have all the complexity behind us.
VAR _grey = "#E6E6E6"
VAR _red = "#A21515"
VAR _green = "#34AC65"
VAR _none = """none"""
VAR _actualValue = [# Total Quantity]
VAR _allVaues =
    ADDCOLUMNS(
        SUMMARIZE( DateKey, DateKey[Year], DateKey[Month] ),
        "@quantity", [# Total Quantity]
    )
VAR _prevValue =
    CALCULATE(
        [# Total Quantity],
        OFFSET( -1, ALLSELECTED( DateKey[Year], DateKey[Month] ) )
    )
VAR _percChange =
    DIVIDE( _actualValue - _prevValue, _prevValue )
VAR _color =
    """"
        & SWITCH(
            TRUE( ),
            ISBLANK( _prevValue ), "none",
            _percChange > 0, _green,
            _percChange < 0, _red
        )
        & """"
VAR _maxValue = [# Max Value in Months]
VAR _actualWidth = DIVIDE( _actualValue, _maxValue )
VAR _barColor =
    """" & IF( _actualValue > 0, _grey, _red ) & """"
VAR _prevValueStartCoordinate = DIVIDE( _prevValue, _maxValue )
VAR _difBarColor =
    SWITCH(
        TRUE( ),
        _percChange = 0, "none",
        _percChange > 0, _green,
        _red
    )
VAR _difBarCode =
    "x="""
        & SWITCH(
            TRUE( ),
            _percChange = 0, "0 "" fill=" & _none,
            _percChange > 0,
                FORMAT( _prevValueStartCoordinate, "0.0%" ) & """"
                    & " fill="
                    & """"
                    & _difBarColor
                    & """",
            FORMAT( _actualWidth, "0.0%" ) & """" & " fill=" & _none
                & "  stroke-width="
                & """1"""
                & " stroke="
                & """"
                & _difBarColor
                & """"
                & "   stroke-dasharray="
                & """4"""
        )
RETURN
    "data:image/svg+xml;utf8,"
        & "<svg xmlns=""http://www.w3.org/2000/svg"">
    <rect y=""50%"" width="""
        & FORMAT( _actualWidth, "0.0%" )
        & """ height=""30%"" fill="
        & _barColor
        & "></rect>
    <rect y=""50%"" width="""
        & FORMAT( ABS( _percChange ), "0.0%" )
        & """ height = ""30%"" "
        & _difBarCode
        & "></rect>
    <g font-family=""Segoe UI"">
    <text x=""25%"" y=""25%"" font-size=""50%"">
        <tspan font-weight=""bold"" fill=""#000000"">"
        & _actualValue
        & "</tspan> <tspan font-size=""75%"" fill="
        & _color
        & ">"
        & "("
        & FORMAT( _percChange, "0.0%" )
        & IF( _percChange > 0, "▲", "▼" )
        & ")"
        & "</tspan>
    </text>
    </g>
</svg>"
And this code gets us to the last and desired variant!
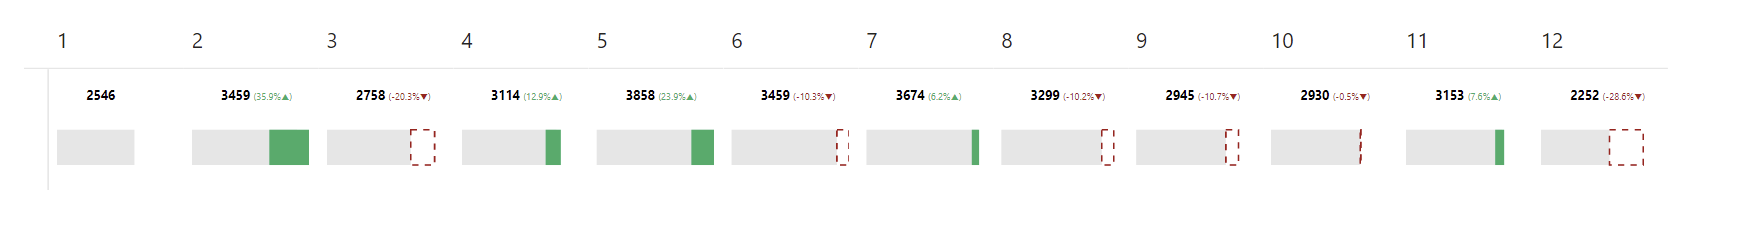 Result
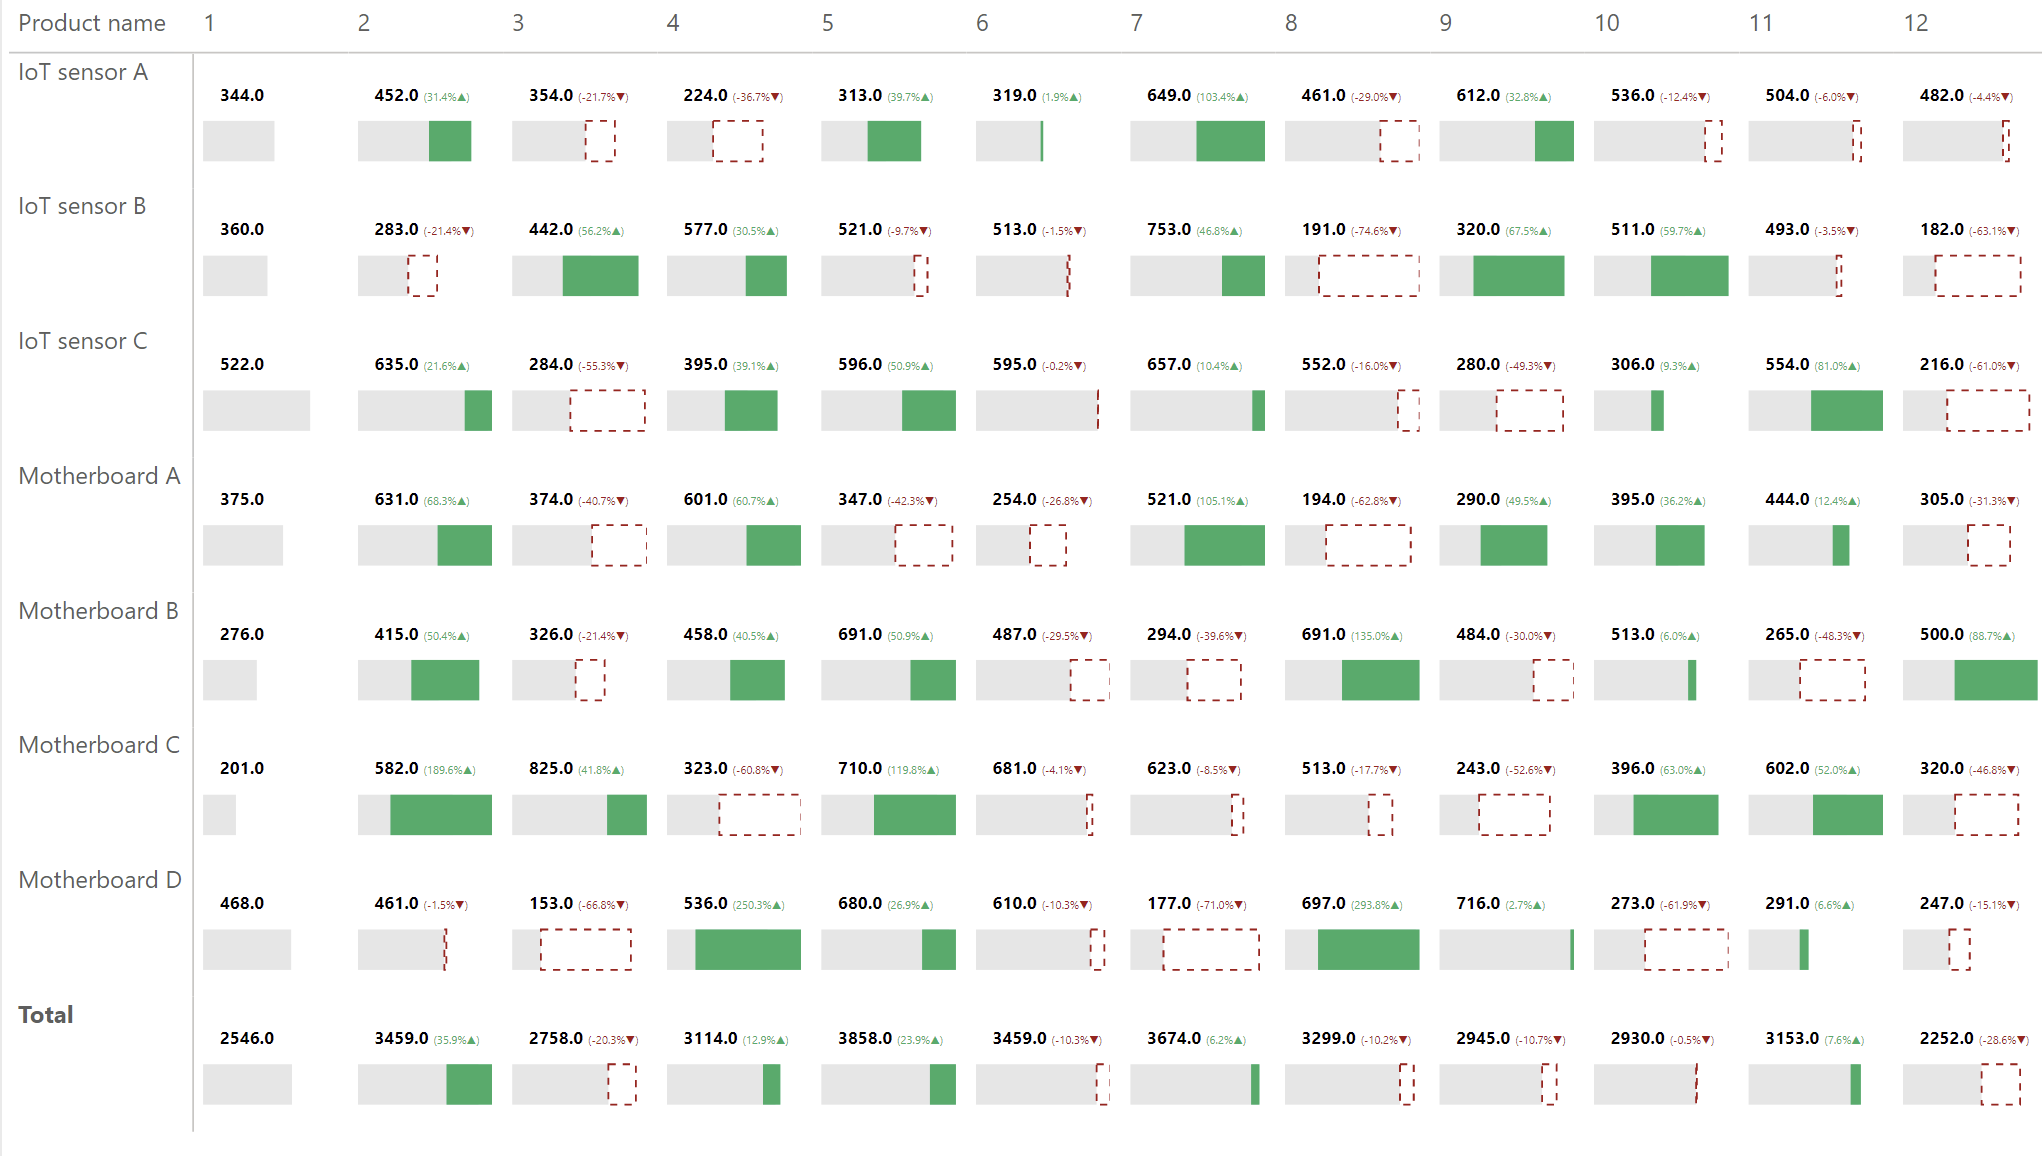
Very well what we succeeded in can be seen in this picture, which shows the individual variants that I have shown here:
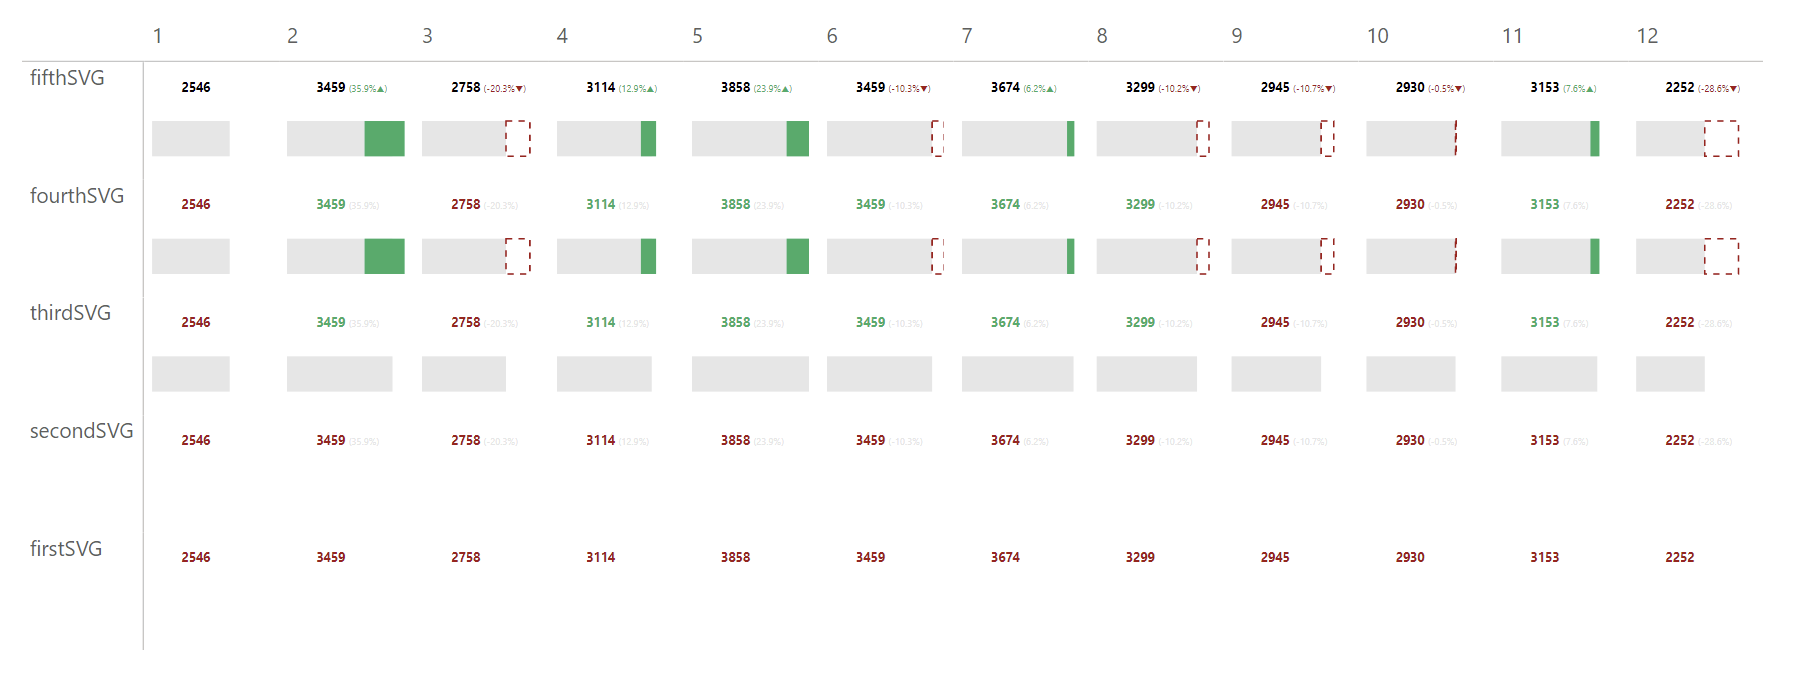 Variants
Final touch
Then remember that those cells can be smaller than they are! It can be adjusted beautifully using the matrix format settings for images!
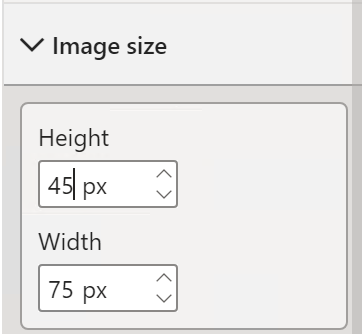 Size settings
The result will be a little better!
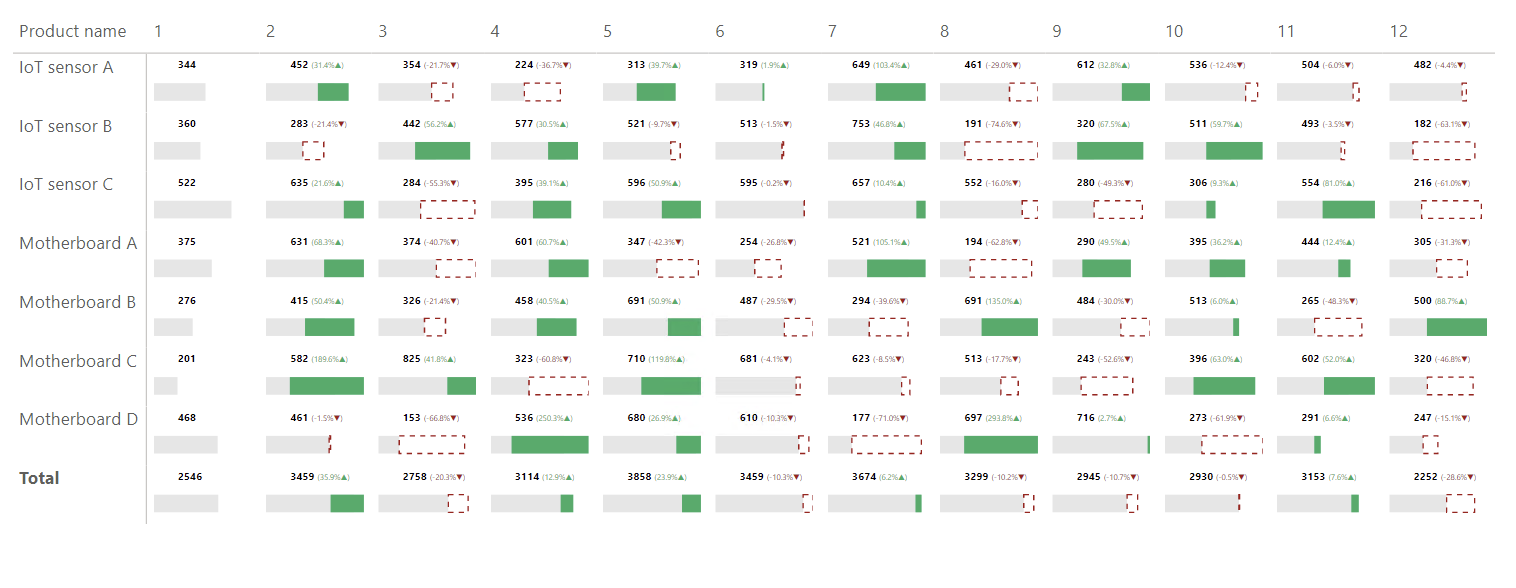 Sized result with Products
Summary
And that’s all for this time. I hope you found this explanation helpful. In general, to produce fully dynamic SVG charts in Power BI, it is necessary to think very strongly about how exactly they should function at which moment and then prepare a lot of DAX code. Which may or may not be a bad thing. It will always depend on the load on the report page and the volume of data from which we calculate these graphs. However, I like these graphs very much because they help me to load and present a large amount of information in a small space within one object. Since pretty much anything can be made within SVG images, it’s now up to everyone’s creativity to capture them as they see fit. I can’t wait to see what you come up with!


